Why Is My SQL Server Query Running So Slowly?
If you work with SQL Server based applications then probably quite a few!
No matter what the application you are working with (CRM, Sales Order Processing, Financial Accounting, Contact Management, Booking System (to name but a few!)) there is a database behind it. Most common applications will store their data in either a Microsoft SQL Server Database or an Oracle Database (of course there are other relational database platforms out there).
Poor Database Performance
- The system is too slow
- Tasks are taking too long
- Applications running slowly or timing out
- Some queries taking forever
- Reports running slowly
- Data entry taking too long
- Database Server not responding very well
Why Is My Database Application Performing Badly?
- Is it the server?
- Is it the client?
- Is it the network?
- Is it the server hardware?
- Is it the server configuration?
- Is it the client application?
- Is it the way the underlying SQL statement has been written?
- Is it the database design?
- Is it the server side programming code?
I could go on.
Something is clearly wrong and you need to diagnose the problem and then fix it, but how do you go about that?
SQL Server Architecture
Firstly you need to think about the underlying architecture of your application deployment. Here is a copy of a whiteboard diagram I draw in our SQL Server Performance & Tuning Course.
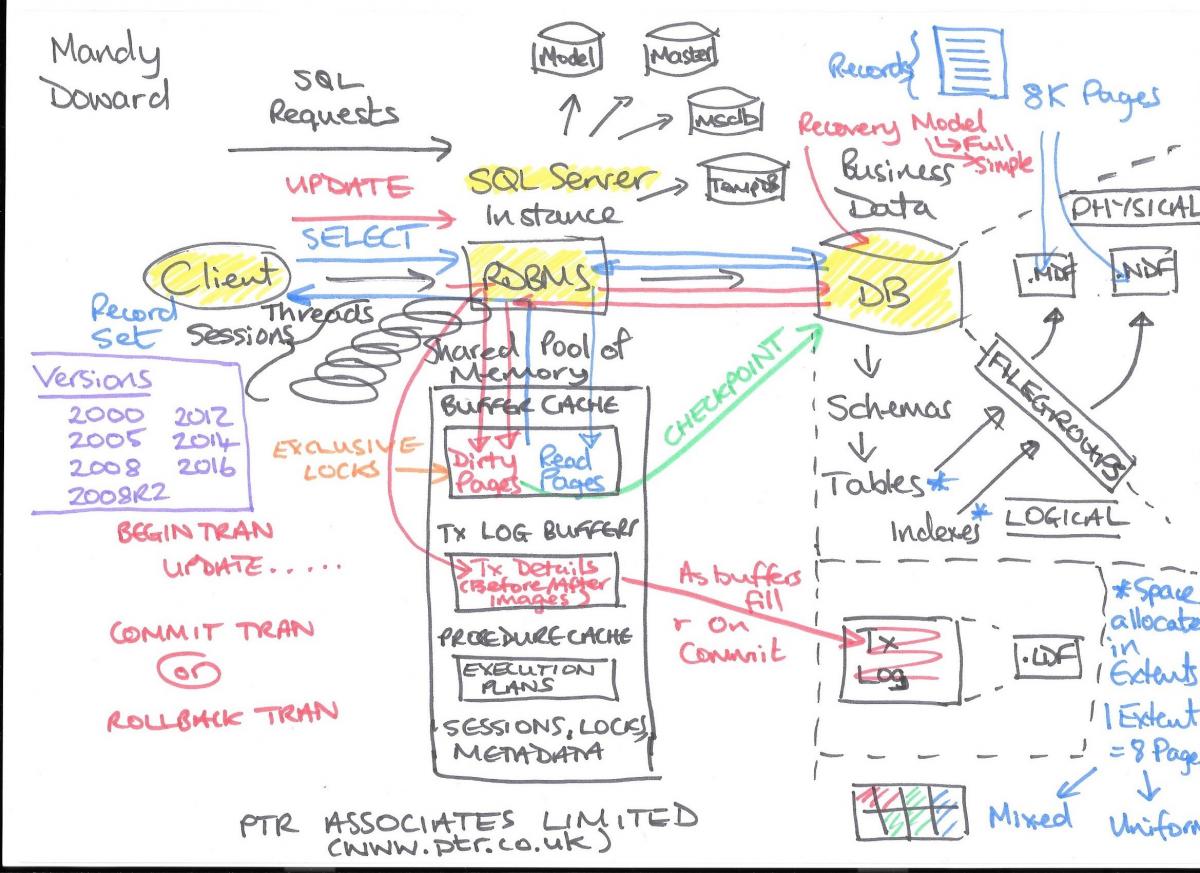
Without this base knowledge of what is going on behind the scenes it is extremely difficult to successfully troubleshoot SQL Server performance problems.
Did you know that all of the following can affect the performance of a SQL Server application?
-
Physical Storage
- Internal disks or SAN drives
- Location of data files and transaction log files
- Location of TempDB data and transaction log files
- RAID volume type
- Number of hard disks
- Type of hard disks: HDD, SSD
-
Physical Resources
- Number and type of Processors
- Amount of RAM
-
Network Topology
- Bandwidth
- Number of Network Cards
- Network Library used: TCPIP, Named Pipes
-
Database Design
- OLTP or OLAP
- Normalised or Denormalised
- Constraints
- Triggers
-
Query Design
- Join types
- Sub Queries
- Views
- Aggregation
- WHERE clauses
- SELECT list
-
Locking
- Blocking and Deadlocks
- Locking Isolation Levels
- Lock Escalation
-
Indexing
- Clustered or Non Clustered
- Covering Indexes: Composite or INCLUDE
- Index Statistics
- Column Statistics
- Index Fragmentation
-
TempDB
- Temporary Tables
- Memory Overspill
- Row Versioning
- Snapshots
The SQL Server Database Engine
The Database Engine (RDBMS in my diagram above) consists of two parts: Relational Engine and Storage Engine.
The Relational Engine includes the Query Optimizer which decides whether indexes will be seeked or scanned, or tables will be scanned. It also decides which join algorithms will be used to join record sets (hash, merge or nested loop). How does it decide? By inspecting your SQL statements, by analysing index and column statistics, by assessing IO and CPU costs. There is an awful lot going on behind the scenes, but if you have an understanding of how the SQL Server Query Optimizer works you will find it much easier to write or advise on how to write more efficient queries.
SQL Server Performance Monitoring & Diagnosis
SQL Server provides a variety of tools that can help you with this:
- Windows Performance Monitor
- SQL Server Profiler (deprecated in SQL Server 2014)
- Extended Events (replacement for Profiler)
- Dynamic management Views
- Built In Stored Procedures
- DBCC
- Data Collection Service
- Management Studio Reports
- Query Execution Plans
And of course there are many third party tools such as Spotlight from Quest that can also help with identifying the cause of poorly performing SQL Server applications.
Here is a peek at these tools.
Windows Performance Monitor
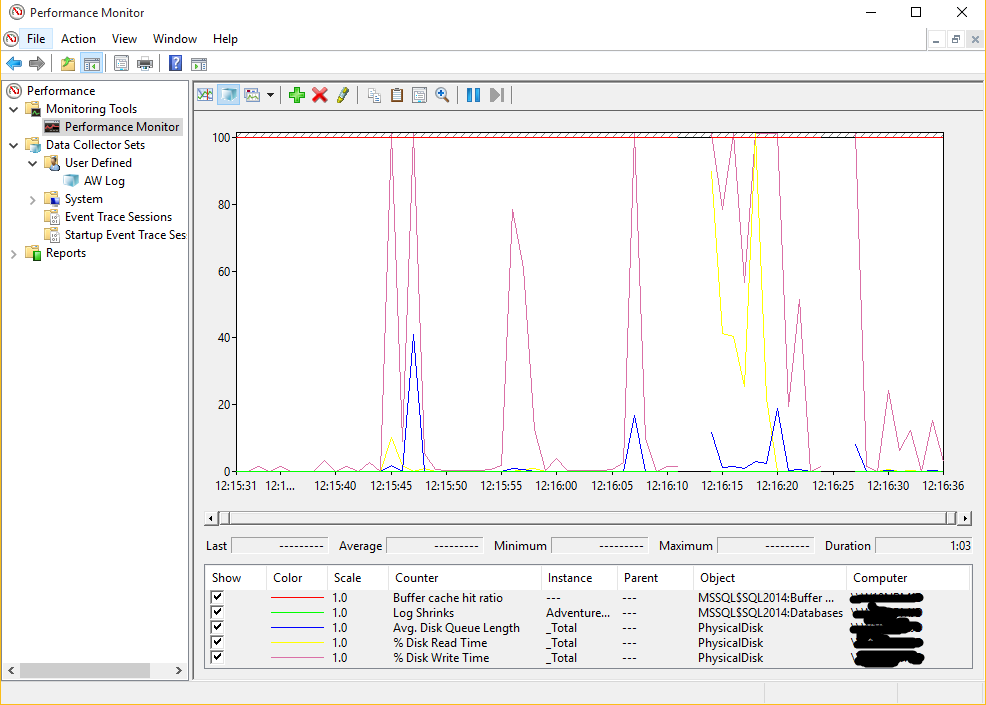
Every SQL Server instance has a set of counters added to the perfmon collection. In the above screen shot we can see that two counters are for the named instance SQL2014 (the default instance would be referenced as SQL Server).
Performance Monitor is really useful for identifying Windows Server, Hardware and SQL Server instance bottlenecks and when they are occurring. What is difficult to do with perfmon (the program name) is to identify exactly which application, user or query is causing the problem.
SQL Server Profiler
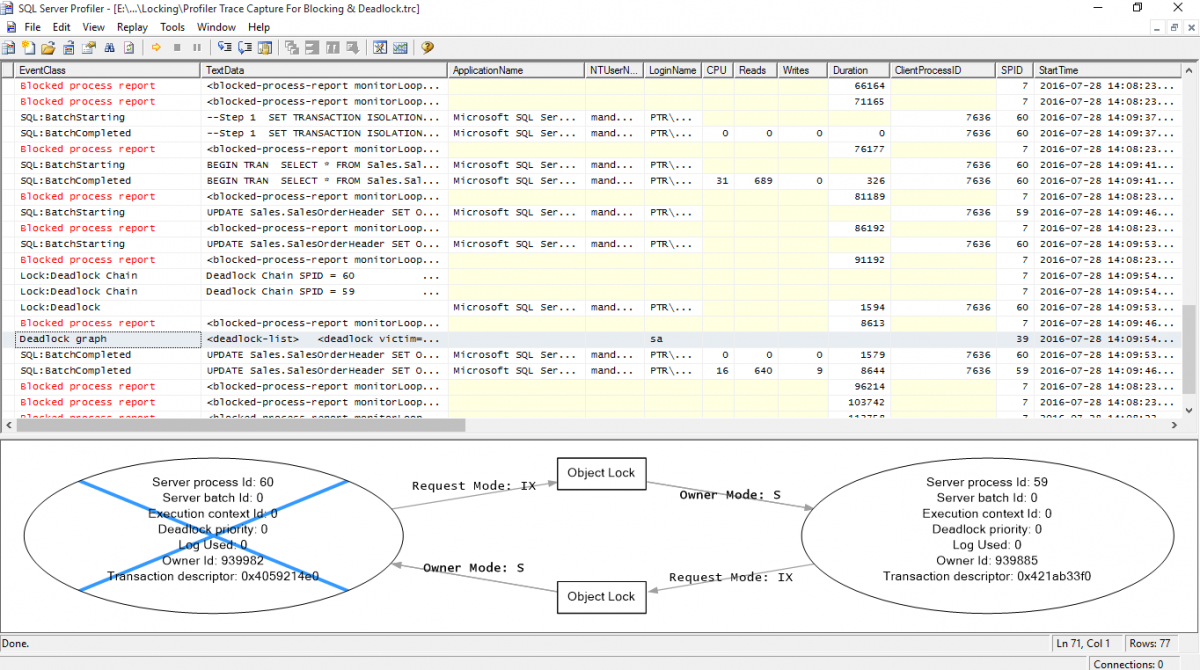
This example of a SQL Server Profiler trace shows a deadlock event that has been captured. We can also see that blocking is taking place.
Profiler enables us to see exactly what was running at the time of a problem, who ran it, where they ran it from, what resources were used, how long it took and plenty more. Filters can be put on the traces to be more specific about what is captured.
SQL Server Extended Events
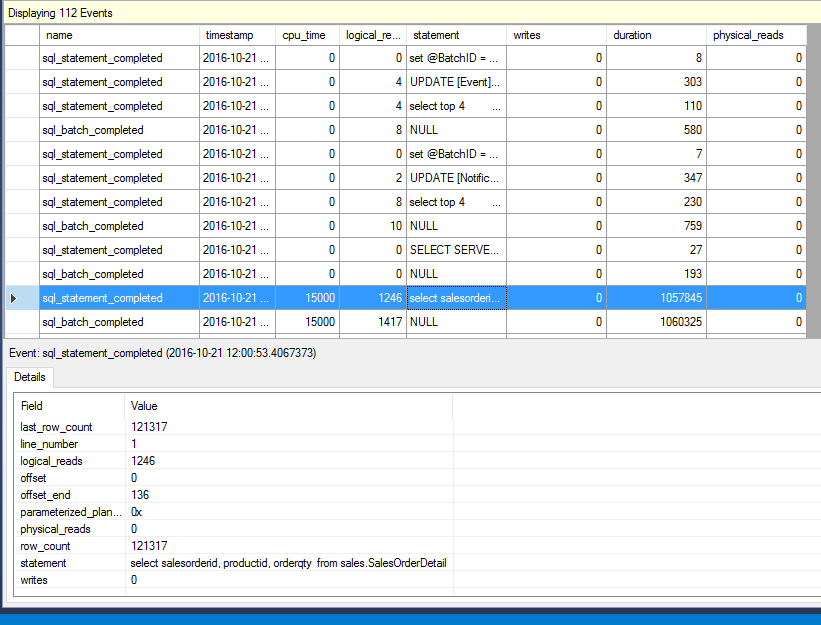
The above example shows a query has been captured and we can see the resource usage and timings for that query. There are many other events and fields that can be captured.
SQL Server Profiler has been deprecated in SQL Server 2014 although it is still available in SQL Server 2016. SQL Server Extended Events takes over from Profiler.
Extended Events sessions can capture everything that Profiler can capture, but it is much more efficient, has a much lower impact on server performance, and allows for more fine grained (filtered) tracing.
SQL Server Dynamic Management Views
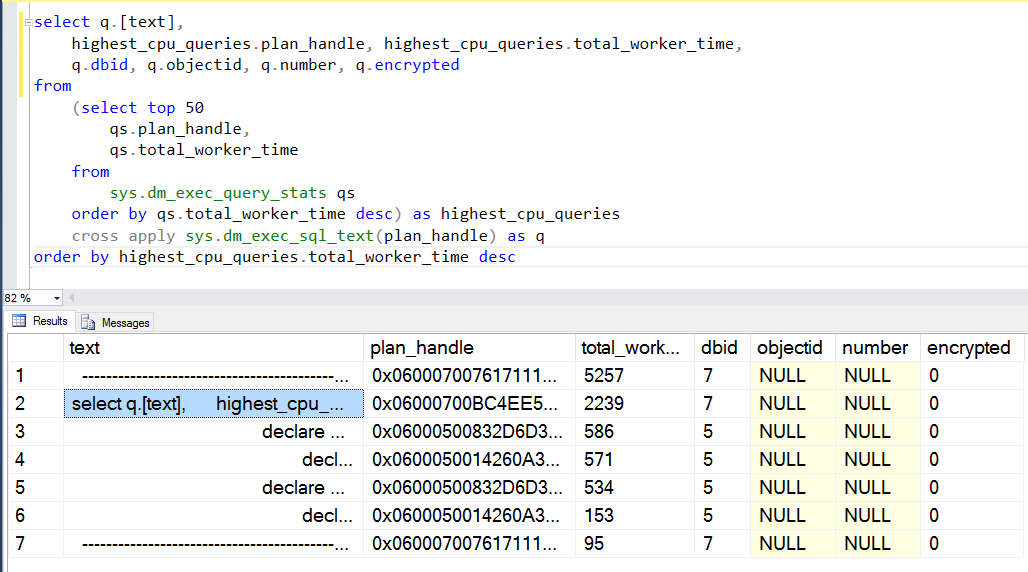
SQL Server is continually collecting performance data behind the scenes and this information is available by querying the vast collection of Dynamic Management views that SQL Server provides. The example above displays information about CPU time for queries running.
The next example shows whether query execution plans are being reused:
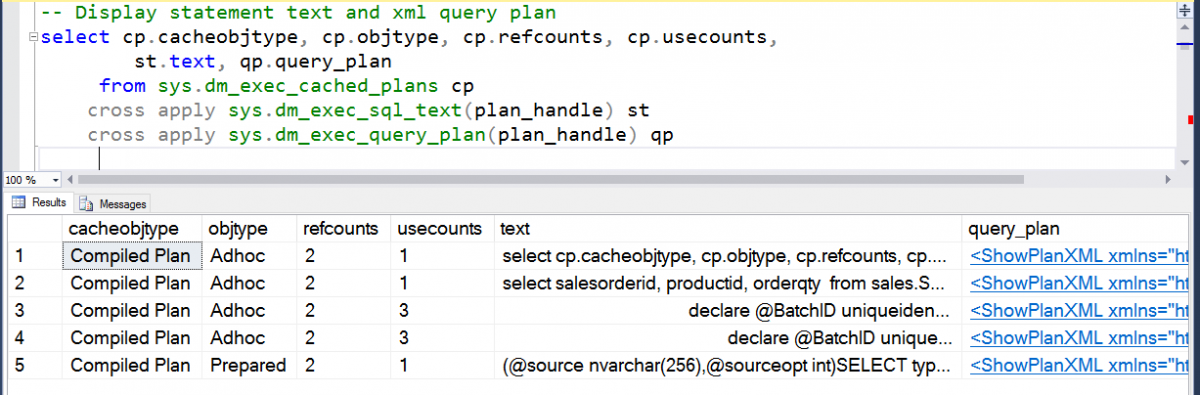
We can see what type of plan it is and we can also click on the link on the right to see the execution plan that was used.
There are hundreds of dynamic management views available.
SQL Server DBCC
The DBCC utility has a number of clauses available. Here are two.
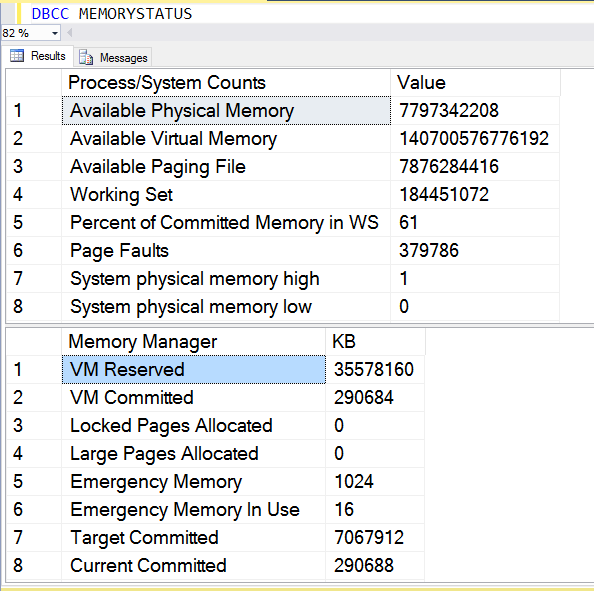
The above example shows memory usage for the SQL Server instance. There is a lot more information available from this command, but it does not all fit on a single screen. Try it on one of your SQL Server instances.
The next example shows information on fragmentation of an index:
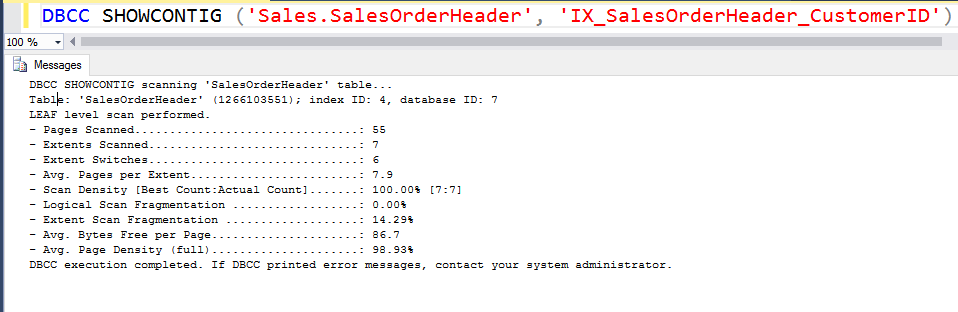
We can see from this example that the index on the CustomerID column of the Sales.SalesOrderHeader table in the AdventureWorks2014 database is well packed with contiguous extents.
SQL Server Query Execution Plan
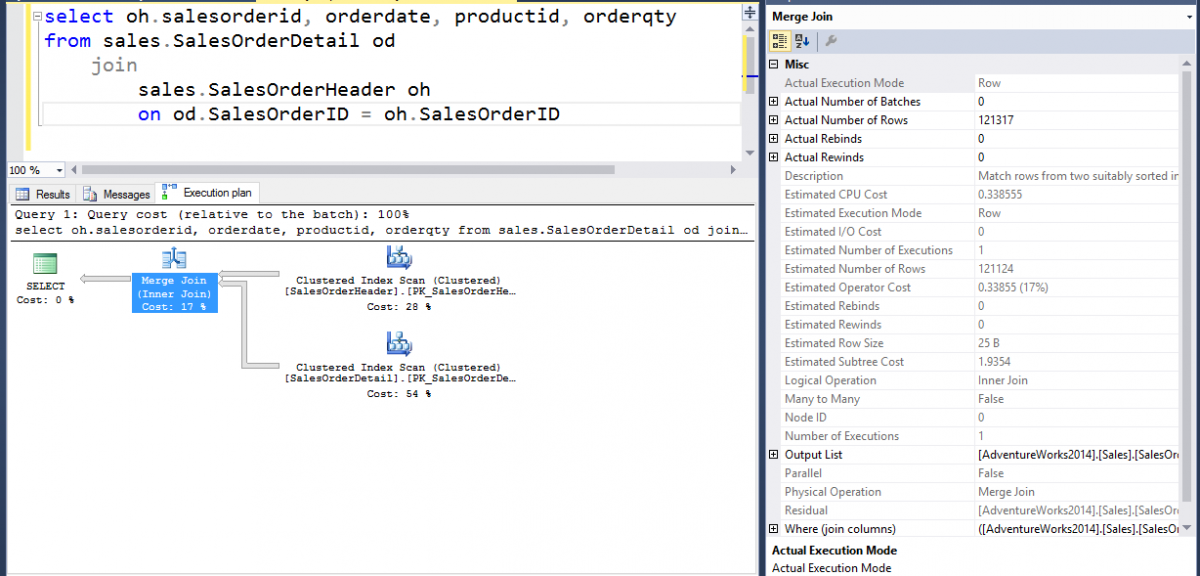
The graphical execution plans available in Management Studio enable us to see whether indexes are being used, which join algorithms have been implemented, record counts and costs associated with each step of a query plan. There is a lot more information at our disposal as well, but much of it will make no sense without a good understanding of the internals of the SQL Server Database Engine.
SQL Server 2016 has introduced an execution plan comparison tool. Take a look at this article for a bit more information on that: SQL Server Management Studio (SSMS) 2016 - Compare Execution Plans
Find Out More
This article just introduces some of the SQL Server Performance & Tuning concepts, challenges and tools.
Feel free to email us if you have any questions at info@ptr.co.uk.