Case Study
Data Strategy Solution - Business Wide View
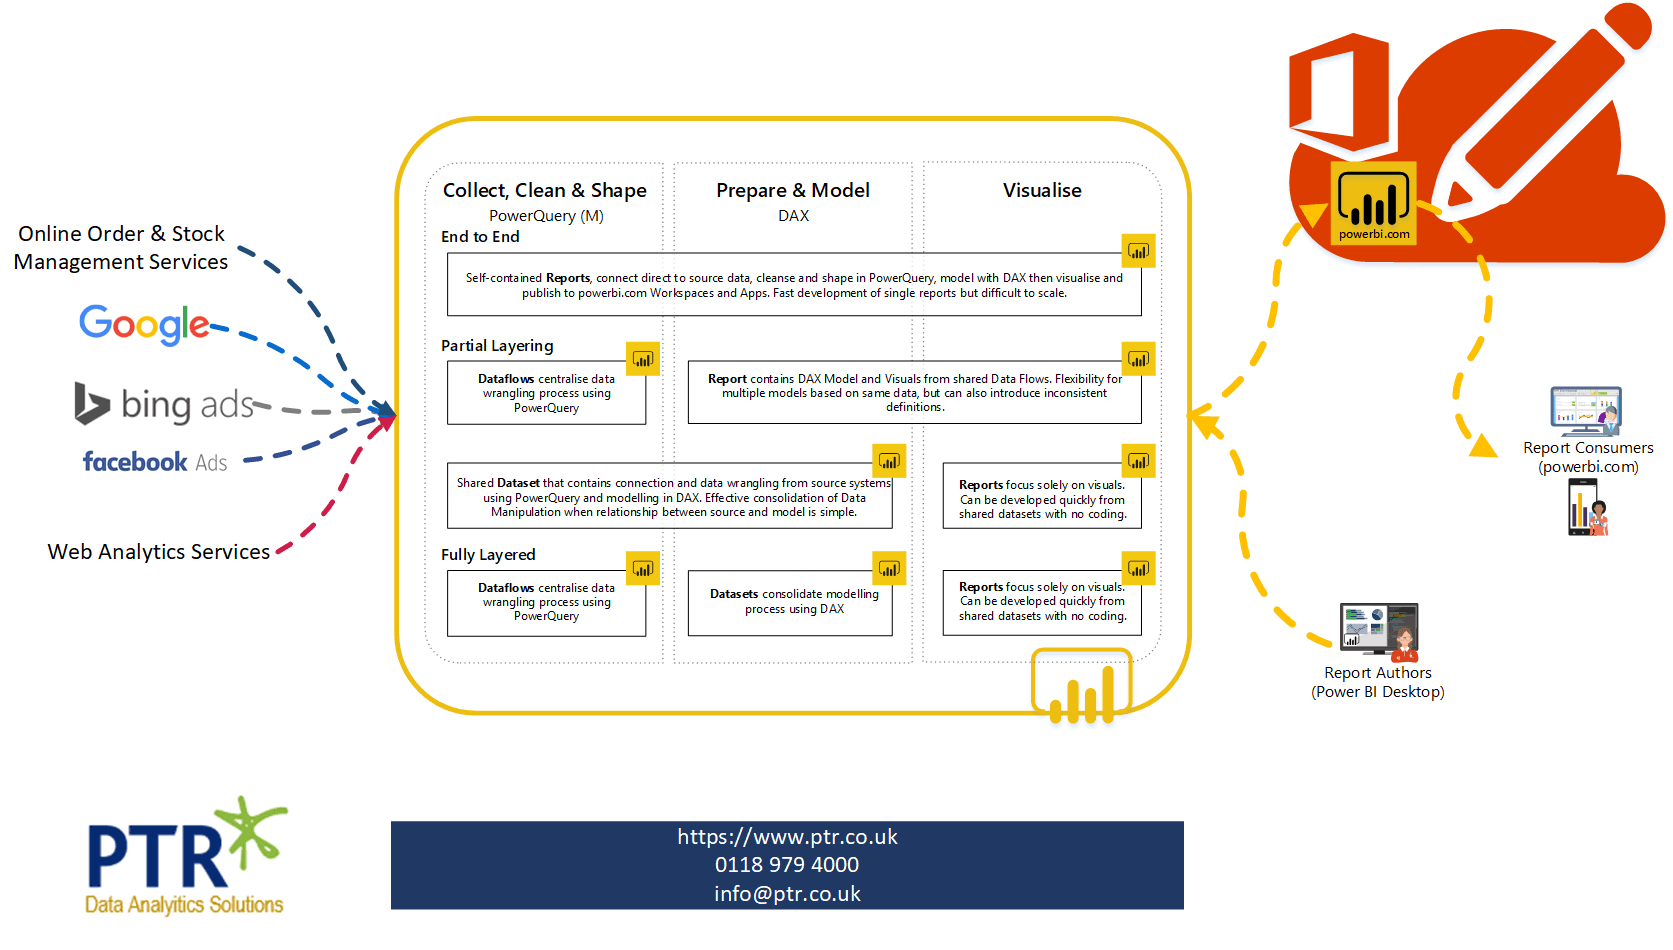
A retail organisation, making use of several well-established online services to fulfil their order & stock management, Point of Sale, Buying and Purchase Order Processing, in addition to numerous online marketing and advertising platforms.

Use case – Engaging 360 view dashboards from disparate data sources
Our client is a retail organisation, making use of several well-established online services to fulfil their order & stock management, Point of Sale, Buying and Purchase Order Processing requirements both online and in store, in addition to numerous online marketing and advertising platforms.As such they have a wealth of data available to them, however currently many of their processes for handling and manipulating that data are very manual and time consuming, incurring a high level of human effort concentrated on a small number of people and meaning that more time is spent preparing data for reports than can meaningfully be spent analysing their output.They wished to streamline the process for collecting and preparing this data so that they could reverse that time balance and relate all these disparate data sources together to get a true business wide view of their data, whilst also improving the quality and user engagement of these reports.
Business Requirement
- Relate disparate data sources for a business wide view
- Streamline current manual data collection and preparation
- Provide richer, more compelling and interactive reports
- Provide a “One Truth” standardized set of key business metrics
- Spend more time analysing data than preparing data
The PTR Solution
The solution implemented was built on the Power BI Premium platform.
- Power BI Premium
- Shared Data Flows
- Shared Datasets
- Power BI Reports
The Benefits
- A single consolidated and clean repository of quality data from all business applications serving as a single source of truth for the organisation
- Well defined relationships enabling comparison of data across different applications for full 360 view of Member engagement.
- Centralised definition of key business metrics such as “Lapsed” or “New” members to ensure consistent, reliable and trustworthy reporting across the whole group.
- A conformed set of business perspectives, such as membership type, time, geography, demographic, that can be applied across all data sets as relevant
- Realtime dashboards accessible from any device, any time, any where
- Rich, visually engaging and interactive reports enabling users to drill in and out of the detail behind the story and see not just the what, but the why and drive effective insight and decision making
Frequently Asked Questions
Couldn’t find the answer you were looking for? Feel free to reach out to us! Our team of experts is here to help.
Contact Us