
Tech Tips
9 Steps to Handling Forecasting in the BI World
Have you battled with trying to get forecasts out to management before they become obsolete? Unlike most of our reporting, forecasting is based on predicting what we need to do in the future rather than reporting on how we performed in the past.

How many of us have battled with trying to get forecasts out to management before they become obsolete?
Unlike most of our reporting, forecasting is based on predicting what we need to do in the future rather than reporting on how we performed in the past. If we’re lucky we may have applications like Dynamics, Netsuite, SAP or Salesforce to help us with forecasts, but all too often it’s left to a handful of Excel spreadsheets. Some may still rely on their gut.
So how much should your forecasting be driven by human instinct, and how much should we be leveraging our own performance data using programmed algorithms and AI?
In this article we explore the challenges of building forecasting dashboards in 9 steps.
- Step 1: What are you forecasting?
- Step 2: Is your forecasting Human or Data Driven?
- Step 3: How is your forecast data collected?
- Step 4: Blending Human and Data Driven Forecast Data
- Step 5: When is your forecast data available?
- Step 6: Gathering forecast data
- Step 7: Forecasting methods and algorithms
- Step 8: Forecasting modelling
- Step 9: Forecasting dashboards
Step 1: What are you forecasting?
Forecasting is an important part of every business. For example, without trying to scientifically predict future demand for product and services, or the cashflow needs of upcoming business operations, clients could be left without the product and service they need. That in turn could lead to losing business now or in the future.
We all have gut feelings about the impact of various factors on our business, for example the impact of:
- Weather on business performance
- Employee holiday on resourcing shifts
- Students starting at school or university
- Christmas shopping
- International tariff changes
- Social media trends
But by using carefully calculated algorithms to predict future demand we get far more reliable results than through gut instinct alone, although there is always a place for human experience as well!
Consider the following forecasting requirements:
- Sales
- Failure Rates
- Service Calls
- Staff Rosters
- Demand
- Stock
- Production
- Order fulfilment
- Idle time
- System load
- Cashflow
- Profit & Loss
When it comes to forecasting and predicting future needs, one business area may be significantly impacted by another. For example:
- Predicted customer demand will impact our stock requirements which in turn may impact our cashflow requirements
- Predicted system failures will impact predicted service calls which in turn will impact staff roster requirements.
Or put another way:
- Staff holidays and absence will impact production capability, which will impact stock, which will impact order fulfilment, which will impact sales and cashflow.
There could be a lot of gut instincts you need to bring into play along with a collection of mathematical formulae stored in various spreadsheets, or even in people’s notebooks.
So, before you can start implementing a proper forecasting solution you need to consider the following:
- Do you know all the contributing factors?
- Are the contributing factors recorded in data or are they held by people with knowledge of their part of the business?
- Do you have access to all the data and the people likely to influence future patterns?
- Do you have access to any special calculations, formulae or algorithms that will be required for accurate forecasting?
- Are any specific industry standard algorithms currently in use to drive forecasting such Auto-ARIMA or ETS?
If you have all of the answers to these questions you are ready to move forward. If you don’t there’s more discovery and planning work to be done.
Step 2: Is your forecasting Human or Data Driven?
Across your business there will be pockets of expertise and experience pertaining to different departments and business processes. When you talk to people to gather all the input you need to implement your new quality forecasting solution, you will inevitably find people prepared to give you confident forecasts without you really knowing the substance behind them.
Sales forecasts might be obtained by looking back over previous years performance, calculating the rate of growth and projecting forward…
- This is purely data driven
Or it may be that a sales director has estimated their forecasts based on conversations with key clients and sales reps and their expectation of future demand.
- This is human driven
The most likely method of calculating forecast figures is to blend data driven trends with human driven instincts and expectations.
The C Suite want accurate forecasts across all business areas to help them create a solid budget and cashflow plan, together with a believable profit and loss projection. If all forecast contributors use gut instinct alone our forecasts are not going to be either achievable or believable.
Forecasting Scenario Example
A sales forecast has an impact on many areas including; production, warehouse management, shipping and delivery, human resources and finances. If one of those forecasts is inaccurate then an entire business plan falls apart and maybe even puts the stability of the business at risk.
The CEO asks the Sales Director for the sales forecast for the next 6 months. The Sales Director confidently provides expected sales figures as requested, but when the CEO dives deeper they realise there are many more influencing factors that need to be considered when forecasting - profit & loss, cashflow, staffing levels, etc.
Which products make up these forecasts?
- Do lead times for production, stock levels etc make these forecasts achievable?
- Will we need additional staff to achieve sales forecasts?
Which clients make up these forecasts?
- Do some of these clients benefit from long payment terms which mean you will be paying for manufacturing or stock way ahead of receiving payment from the client?
- Do you provide warehouse space for a client’s product and will you have enough space to make these forecasts achievable?
Do these forecasts rely on promotional, marketing or advertising campaigns?
- Do we have budget and resource for the planned marketing activities?
Do we have the resource to achieve these forecasts?
- Will we need to increase staff members on the production team, picking team or shipping team to achieve these forecasts?
Do the monthly splits of these forecasts reflect seasonal trends and staff holiday?
- Have we taken into account seasonal annual leave that may affect a team’s ability to manufacture or fulfil client orders?
- Are some of the products only available for specific seasons?
- Do you have the cashflow to support the sales figures presented?
We could go on, but the point here is to demonstrate that a forecast sometimes needs more than a gut instinct.
If the sales forecast is accurate and turns into reality, then:
- extra cashflow may be required to support the plan
- extra staff may be required
If the sales forecast is inaccurate and we have taken on extra staff we are left with that burden of staff even though the sales do not come in – our income is down, our costs are up, or profit and loss and cashflow are down.
Step 4: Blending Human, External and Data Driven Forecast Data
Both human driven and data driven input is essential to successful forecasting and planning so it is likely that the forecasting model driving your dashboards will need to capture both.
Sometimes we will also need to adjust our forecasts based on external factors such as a global pandemic, severe weather warnings, war, or a financial crash.
So......
How will you capture human driven forecast data?
- Spreadsheets or purpose-built application?
How will you capture the confidence level of a human driven forecast?
- % value to indicate likeliness?
Do you trust the human driven forecast?
How can you feed external influencers into your forecasting?
How will you capture human driven forecast data?
To ensure the human driven forecast data can be used within your BI world, the forecast data will need to be provided in a consistent format, perhaps in an Excel spreadsheet, or perhaps captured by a purpose built Power App that populates a database table somewhere. This article on Using Power Apps, Power Automate and AI Builder for Forecasting shows how the Power Platform can help with collecting forecast data.
You will need to think about the grain of your forecast data. Should it be captured as a total forecast value for a financial period, or should it be broken down into smaller groupings such as a forecast for each product/service, or a forecast for each client? This will be influenced by the drill down and sanity checking capabilities you would like to have available within your forecast dashboards.
How will you capture the confidence level of a human driven forecast?
Many applications like NetSuite, Salesforce, SAP and Dynamics enable sales reps to enter a confidence or probability percentage against each sales opportunity. If you don’t have such an application, then perhaps you will ask for a spreadsheet listing all opportunities along with a probability percentage.
Do you trust the human driven forecast?
Whether a probability percentage has been added via an application or in a spreadsheet what is our level of trust and confidence in these figures?
- If a percentage is simply made up by a sales rep, then we may have very low confidence.
- If a percentage has been calculated by our sales application using algorithms we know and trust, then we may have very high confidence.
By blending human and data driven forecast data we can help create greater levels of trust..
- We could use historic win ratio data to calculate a confidence level for forecasts
- We could use historic data to establish how long it typically takes for a lead to be closed to predict future close dates and also to ensure our forecasts are sitting in the right financial periods.
How can you feed external influences into your forecasting?
The ability to enter some key external influencer weightings or ratios to overlay or adjust your forecasts, could be beneficial when circumstances beyond your control mean forecasts need revising.
You could consider using a Power App form to allow manual entry of the key influencers, which in turn are stored in a database and consumed by your semantic model for forecast measure calculations. The Power App form could be embedded within your forecasting dashboard to keep it all in one place and allow “what if” scenarios to be easily handled.
You could use Power BI parameters within a dashboard that allow entry of key influencers for use in forecast measures. This method does not store the parameter sets in the way a Power App could.
Step 4: How is your forecast data collected?
Is your forecast data collected in a purpose-built application or is it collected in a suite of Excel spreadsheets?
If all our forecasting intelligence is in applications that are feeding into our data warehouse environment, we might have an easier job producing forecasting dashboards as it is all coming from an underlying structured database or application repository:
- Data is structured
- Data is consistent
- Data is validated
- Data is complete
If forecasting data is provided through spreadsheets we have a very different challenge on our hands:
- Data is likely entered freehand into a spreadsheet
- Every spreadsheet is likely to be different. Yes, it may have started with a template, but extra columns get added, formats get changed, extra worksheets added in
- Missing data due to cells not being filled or formulae being tweaked generating errors
- Data errors are common, due to mis-typing or entering values in the wrong cell
It is common practice to calculate a Forecast Quality Score.
For example:
- Applying different value weightings to certain products, services or activities
- Applying probability percentages
- Applying an algorithm that handles historic and typical lead to close or manufacture to ship performance.
Even with purpose built forecasting software there may be some business logic that you need to apply that is not handled in the application itself. Who defines these algorithms and where are they located?
Step 5: When is your forecast data available?
Forecasting often relies on human input in a timely fashion. How do you ensure all your forecast data is available in time for releasing forecasting dashboards and reports?
Do you have an alert system to remind people it is forecast time?
Or is all your forecasting based on historic performance and, therefore, fully automated and available?
If you are relying on human beings to remember to make data available, then perhaps a Power Platform solution can help? This article on Using Power Apps, Power Automate and AI Builder for Forecasting may be of interest to you.
Step 6: Gathering forecast data
Once you have established where all the required forecast data is located you can work on a pipeline to load it - whether sourced from data driven or human driven sources - into a central repository, that is your lake house, or data warehouse, ready for preparation for dashboard use.
Fabric or Azure Data Factory pipelines and/or Fabric or Power BI Dataflows offer flexibility to ingest, prepare and transform all of your forecasting sources.
Step 7: Forecasting methods and algorithms
There are many industry standard forecasting algorithms that have been implemented by application vendors, but you may also have your own unique algorithms defined in an application, or in an Excel formula.
Before modelling your forecast data for feeding insightful dashboards you will need to have captured the logic for all forecasting algorithms relevant to your business forecasting world.
Here are some examples of application algorithms.
Dynamics 265 Supply Chain:
- auto-ARIMA
- ETS
- Prophet
- XGBoost
SAP Algorithms:
- Adaptive-Response-Rate Single Exponential Smoothing
- Auto-ARIMA/SARIMA
- Auto-ARIMAX/SARIMAX
- Automated Exponential Smoothing
- Brown's Linear Exponential Smoothing
- Copy Past Periods
- Croston Method
- Croston TSB Method
- Curve-Based Method
- Daily Disaggregation Optimization
- Demand Sensing with Multiple Linear Regression (Full, Legacy)
- Demand Sensing with Multiple Linear Regression (Update, Legacy)
- Demand Sensing with Gradient Boosting
- Double Exponential Smoothing
- External Algorithm
- Extreme Gradient Boosting
- Gradient Boosting of Decision Trees
- Multiple Linear Regression
- Seasonal Linear Regression
- Simple Average
- Simple Moving Average
- Single Exponential Smoothing
- Triple Exponential Smoothing
- Weighted Average
- Weighted Moving Average
Salesforce Algorithms:
- ARIMA — Autoregressive Integrated Moving Average
- ETS — Exponential Smoothing
Step 8: Forecasting Modelling
Fabric or Power BI semantic models (shared datasets) are the perfect location for capturing the forecasting logic and calculations.
Some transactional level forecasting calculations may be better handled in the lake house or data warehouse layer, such as applying confidence or probability scores to an individual forecast value.
Where forecast algorithms are based on complex historic aggregations the logic would be better defined within the semantic model layer. It can be done at the lake house and data warehouse layer through languages such as SQL, but it is far more complex.
All your forecasting measures can be defined within the semantic model ready for a drag and drop into appropriate visuals in Power BI dashboards:
- forecast values
- confidence scores
- probability scores
- forecast quality scores
- forecast bias
- mean absolute deviation (MAD)
- mean absolute percentage error (MAPE)
If your business implements sophisticated forecasting applications, then your forecasting modelling may simply be a case of bringing pre-calculated metrics into your model.
If your business does not implement specialist forecasting tools and applications, then you will have a significant amount of maths to do and measures to create in your model using a language such as DAX if your model is built in a Microsoft Power BI or Fabric environment. This will most likely be one of the most time-consuming stages of building your forecasting dashboard solution.
Step 9: Forecasting dashboards
The visualisation stage for forecasting dashboards is probably relatively straight forward. The hard work is in extracting and generating accurate forecast data to be added to visuals.
Power BI offers a variety of visuals that can assist with communicating forecast data to business users in a clear and insightful way. Line and bar charts are a common way of presenting forecast data.
Here are a couple of examples of forecasting dashboards.
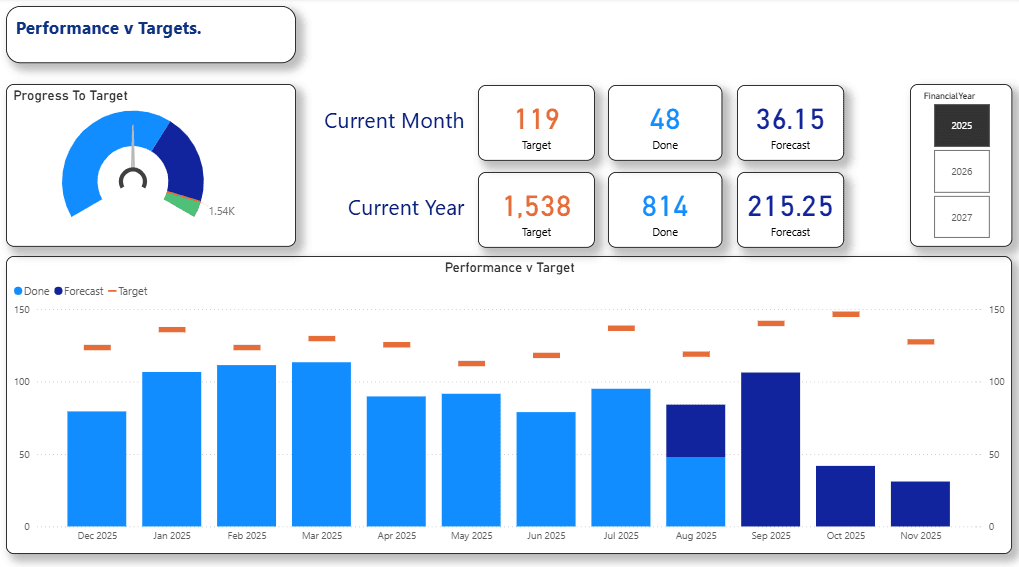
Bar Chart with Target Line
The following chart is a very simple way to communicate targets, actuals and forecasts to give an indication of where we expect to be by the end of the financial year (Dec to Nov in this example).

The gauge shows overall performance and the chart shows actual and forecast v targets month by month. The score cards add a clear indication of underlying values.
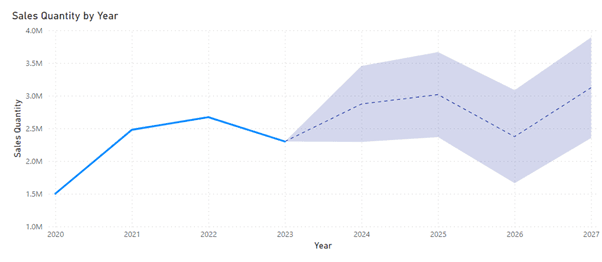
Power BI Forecasting Feature
Power BI also offers a Forecasting feature, driven by a machine learning algorithm to predict future values based on historical data. Take a look at this blog to find out a bit more about How to Use the Power BI Forecasting Feature.
Step 10: Getting Started with your Forecasting Dashboards
To summarise it is often the case that the visuals and dashboard pages for a forecasting report are relatively simple, but the work behind the scenes to capture forecasting data, validate and adjust it using trusted algorithms and historic performance, can be extremely time consuming and complex.
Wrangling with all of this and creating a solution that delivers on accuracy and trust, as well as delivering punctual dashboards in an automated fashion takes a lot of planning and careful design.
A multitude of skills may be needed to successfully deliver a suite of forecasting dashboards, from business knowledge and appreciation of forecast influencers and value, mathematical skills, SQL, DAX, and then the creative skills to deliver the forecasting story.
Our team of consultants at PTR have vast experience in working with forecasting challenges across a wide spectrum of industry types. There is not much we have not already encountered. If you would like to discuss how we might be able to help you with your forecasting challenges do get in touch. Whether it be mentoring you and your team or delivering an entire solution we are here to help.
MD
Mandy Doward
Managing Director
PTR’s owner and Managing Director is a Microsoft certified Business Intelligence (BI) Consultant, with over 35 years of experience working with data analytics and BI.

Frequently Asked Questions
Couldn’t find the answer you were looking for? Feel free to reach out to us! Our team of experts is here to help.
Contact Us