
Tech Tips
Semantic Modelling & Business Logic
Clean, quality data alone is not enough to enable you to deliver a 360 view of your business. Shape your quality data into a central, shared semantic model that represents your gold seal business language and business logic.


Over the last few months we have taken you on a data journey in our monthly newsletters from data discovery through to data cleansing and building your single source of truth repository.
This month we focus on how to shape your quality data into a central, shared semantic model that represents your business language and business logic, and also provides a secure gold sealed set of hierarchies, measures and KPIs that can confidently be consumed by reports across your business.
Clean, quality data alone is not enough to enable you to deliver a 360 view of your business. To give your data meaning and to enable your business teams to interpret the data in an insightful manner you will need to take some time to model your data to make it work effectively for you.
In this article we look at your journey for clean, trusted data to central business logic and KPIs. Here are our 7 steps to semantic model success:
- Step 1: Identify your challenges and desires
- Step 2: Pick your key players
- Step 3: Define your gold standards
- Step 4: Plan for Unified Reporting
- Step 5: Plan for Semantic Modelling
- Step 6: Build your Semantic Model
- Step 7: Visualising and Story Telling - the next part of the journey!
Step 1: Identify your challenges and desires
You have beautifully clean, accurate and complete financial, sales, and project management data, but ask yourself the following questions:
- Can you link your invoices to sales and your sales to projects?
- Can you link all three data sets to a single customer, or a single project, or single point in time?
- Does your native finance data give you a gross profit figure for a month, year, customer or project?
- Does your native data cater for custom financial calendars, with non-standard starting months, or 13 period years, or 5 week months?
- Can you extract year to date figures from your native data?
- Can you easily extract your projected project work over a project's expected duration?
Of course you could just use Excel, pull the clean data into worksheets, use some VLOOKUPs to link across datasets and construct some Excel formulae to create your gross profit, year to date figures, complex date expressions to handle non-standard financial calendars. Why not? Well…
- Who defines the formulae that are behind your gross profit and year to date figures, for example?
- Who has access to the spreadsheet?
- How do you restrict or control access?
- Could data be overwritten?
- Could formulae be overwritten?
- How many spreadsheets do you have all importing the same data but with different versions of VLOOKUPs and different versions of Excel formulae?
- Who has the advanced Excel skills that might be needed to prepare such a spreadsheet?
- How do you stop people taking copies of the spreadsheet and creating their own variants?
- How do you ensure no other "dirty" data sources are brought into these spreadsheets and used in calculations?
- How long would it take validate all the spreadsheets before they are released for use?
One set of figures, many answers
Have you ever been in a meeting where several people present figures on something like revenue, only to notice that all their totals are different?
How can that happen?
Each of them is presenting their own independent report supposedly using the same source sales data, so why don’t the totals match?
Here are some possible answers:
- Each has used different categories to group the data, based on relevance to their own department. The quality of the source data might contribute to this issue – for example if not all base records have the relevant category values set and therefore "disappear" from the report figures.
- Perhaps each person has used a different definition of "Revenue" with a different calculation behind it.
- Is there confusion over whether you are breaking figures down by calendar year or financial year?
- There could be a discrepancy over what defines a customer - is a customer someone who has enquired, or someone who has ordered?
- Perhaps an unsupported hierarchy has been used to drill down at a level not supported by the data - for example, incorrect profit reporting due to an order level delivery charge being repeated for every item rather than allocated across items.
If you would like to learn more about the cause and solution to inconsistent business language and definitions take a look at this blog - Why a Single Business Dictionary Drives Clarity | PTR.
Step 2: Pick your key players
Your BI success relies on having the right team in place. Your dream team should consist of key players from across the business your are delivering this solution for, not just the techies.
You will need to identify the business partners / stake holders across all areas of the business that you are striving to deliver a single central semantic model for. They are the people who know the needs of the business department, and know what data they have or need for reporting and analysis. They are also the ones that will be able to pull together the dictionary of terms and calculations/metrics definitions that form their business language and KPIs.
Step 3: Define your gold standards
With your dream team in place you can work towards defining your gold standards for your reporting repository – your ideal semantic model.
What are your goals?
- Single Source of Truth
- 100% clean, validated and trustworthy data
- One Business Data Dictionary
- One definition for Business Logic
- One validated and secure repository to feed all business dashboards
- Gold seal approval for business reports and dashboards
Having one central repository for all your reporting will get you a step closer to having a full 360 view of your business, with everyone using the same business language, standardised key performance metric definitions (KPIs) and only drilling down into data to levels that the dataset supports.
Step 4: Plan for Unified Reporting
Planning is the key to success. To build a successful unified reporting system there is a lot of ground work and planning to get through. Not only do you need clean and complete data which is at the right grain for rolling up and down business hierarchies but you also want a common data dictionary and an agreed set of metrics and calculations.
Successful projects start with stakeholder workshops, setting out the project goals and benefits, and gathering information about all the reports and data sources currently in use. Getting information from across the business is the best way to get a complete picture of where data overlaps, common reporting needs, differences in business language and performance metric definitions, which could lead to confusion when different departments are collaborating.
So, what do we want to achieve/create during the planning process?
Data Dictionary
One very important document to come out of this planning phase is the business data dictionary. You will need to create a document containing every business term, what it means or represents, and what the definition/calculation for any metrics should be. Two things should only have the same name if they are truly identical. If the definition is not the same then names must be changed to reflect the differences, business users should never be confused!
Business Processes
For each business function you need to capture the business processes you want to report on. Only when you know this can you capture the right data and store it at the appropriate grain.
For example,
- do you want to have sales order records that are summarised at the order level, or do you want to be able to drill down to see individual items on an order?
- do you want to summarise project work at the weekly level or will you want to drill down to a daily level?
Can you support the grain of data requested?
Once you have identified the grain of your data, you will need to verify that every field you wish to store at that grain is indeed at that grain. Let’s take an earlier example - a delivery charge that is captured by a sales order processing system at the order level rather than the item level.
If there are 10 records for an individual order, but the order only has a single delivery charge, how are you going to calculate a true profitability figure?
Is it accurate form a business perspective to simply allocate the delivery charge equally across the ten items? What if one item only cost £1.50 to ship and another cost £150 to ship? Allocating evenly would make it look like you low value item is resulting in a loss.
If you do choose to store an aggregated value on a line item level record then you will have to think about handling that in your performance metric definitions to ensure you don't get inflated delivery charges when rolling up or meaningless delivery charges when drilling down.
Conformed Dimensions
By working with all business functions and gathering their reporting needs you will be able to identify where there are overlapping entities such as customers, products and dates.
If you wish to be able to compare one set of business process performance data with another, such as showing customer sales along with customer support calls and invoice value, then you will need to have a single Customer entity that can be related to Sales data, Customer Services data and Finance data.
Each separate system is likely to have its own definition of a Customer, with very different fields and attributes, but somehow you need to integrate them into a single customer record with all the required attributes from the three systems.
Not an easy task when they have different names and IDs in each system!
Mapping Tables
One way of enabling customer fields in different systems to be brought together is to create a mapping table that maps customer names and IDs from each system into a single lookup record.
If you don't already have one in place you might want to think about implementing a Master Data Service, where data owners can create authoritative lookup tables for all mapping requirements across the business.
Step 5: Plan for Semantic Modelling
After the information gathering and fact-finding stage you need to consider what your Semantic Model might look like.
A Semantic Model is a user-friendly framework for business data that exposes business language making it easier for non-technical business users to interact with.
Your data dictionary, business processes and conformed dimensions will drive the shape and design of your semantic model.
Typically a semantic model will present a star schema design with fact tables representing business process and hosting performance metrics, and dimension tables representing objects of interest hosting attributes that are used for identity, filtering and grouping and relate to the business processes. Relationships will be created between fact and dimension tables only.
The Semantic Model will be the source for reports and dashboards enabling consumers to drag and drop fields into visuals without having to worry about how things are related, or what the correct formulae or maths is for a metric. They can focus on the story telling!
Where Should Your Semantic Model Be?
Typically, the semantic model will reside on a platform like Power BI or Microsoft Fabric - a tabular model hosted in the cloud.
Ideally you will build a data warehouse that presents a star schema that matches you semantic modelling needs, resulting in minimal transformations, and remodelling to be done in the tabular model as the model can simply ingest the data warehouse tables as they are. All that is required is to ensure the relationships between your fact and dimension tables are correct and you are ready for the business logic modelling to commence.
Here I will focus on Power BI and Microsoft Fabric as semantic modelling platforms. Both of these offer:
- Power Query and Mscript
- DAX
Power Query and the Mscript language support the initial importing of data and shaping/transformation of that data to get it ready for modelling. If you are implementing a data warehouse this will not be required as all the importing and preparation of the business data can be handled in the data warehouse stage.
DAX - Data Analysis Expressions - is the language developed by Microsoft that allows the modelling to be carried out, creating calculations known as measures that represent the key performance metrics required for reports and dashboards. DAX can also be used to create calculated columns to tables within the model.
Key questions to ask;
Do you need a data warehouse?
Where will your semantic model be hosted?
Where should business logic be created?
Do you need a data warehouse?
If you are implementing a fairly small project then you may decide that you don't need a data warehouse and that your semantic model can be built entirely within a framework such as Power BI or Microsoft Fabric, utilising Power Query (Mscript) and DAX.
Where you have extensive source systems and complex transformations are needed to shape the data, a data warehouse is likely to be the most appropriate starting point. ELT utilities combined with Databricks, Python and SQL can provide a much simpler means of coding the transformations and calculations than trying to achieve it in a language like Mscript or DAX.
Another thing to consider when asking if a data warehouse is sensible, is performance. The more you ask of Power Query or DAX the slower your reports and dashboards are likely to be because the code is executed on demand when models or dashboards are refreshed.
Pre-preparing as many calculations as possible before data hits the model will create a higher performing solution and ultimately a better user experience.
In an ideal world you will have a Data Warehouse hosting your star schema. Where this is the case any calculations that are at the same grain as your fact tables should be added into the data warehouse fact table, and any derived columns such as categories should be added into your data warehouse dimension tables.
Calculations added to the semantic (tabular) model should be those that require aggregations, rolling up to levels higher than the grain in a single fact table, or calculations derived from multiple fact tables.
The truth is that your semantic modelling can be implemented in many ways. Your planning phase should have identified the correct location for the business logic you need and whether that is going to require Python, SQL, Mscript or DAX.
Where will your semantic model be hosted?
There are many market offerings for hosting semantic models.
In theory you could host your semantic model entirely in a data warehouse, with summary fact tables providing rolled up aggregated views of your data but in fact, reports and dashboards built from data warehouse only solutions are likely to be far less flexible.
It is most likely that, even if you have a data warehouse, you will implement a dedicated semantic model layer in your solution on a platform such as Power BI or Microsoft Fabric.
Power BI and Microsoft Fabric are designed to handle the aggregation of large volumes of data quickly. The semantic model is hosted in memory, unlike your typical data warehouse, which will locate it in persisted storage. DAX offers an extensive function library to handle complex time intelligence, aggregations, rankings and data relationships.
Where should your business logic be created?
In simple terms your business logic should be as far back as possible so that it is calculated once and is reusable for all analytical and reporting needs.
Any business logic which is at the detail level, the grain of your fact tables, or an attribute of your dimension tables, should be handled before reaching the semantic model. If it can go in a data warehouse, assuming you have one, then put it there. If it can't go in a data warehouse or you don't have a data warehouse then consider creating a shared dataset using Power Query, that can in turn be used as a source for one or more semantic models.
Any business logic that involves aggregation or ranking of data or involves values from multiple fact tables (business processes) should be handled in the semantic model.
Step 6: Build you Semantic Model
The semantic model is where your data dictionary, business hierarchies and business metrics are created and presented to the reporting and analytics world.
A semantic model consists of the following main objects:
- Tables
- Relationships
- Hierarchies
- Measures
The semantic model represents your business data using your business language and relates data from different business processes to make it easy to produce 360-degree reports and dashboards in a drag and drop manner.
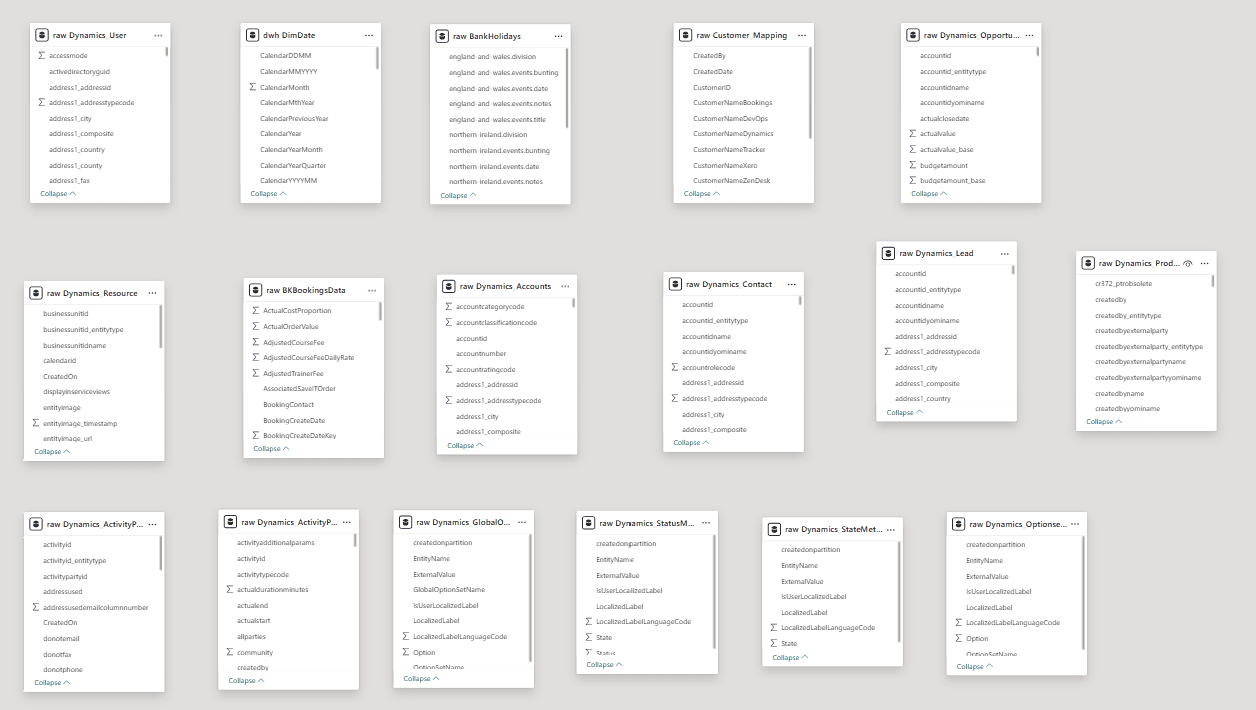
It will take us from this set of raw sources where we have meaningless table names, meaningless column names, and no relationships between data sources:
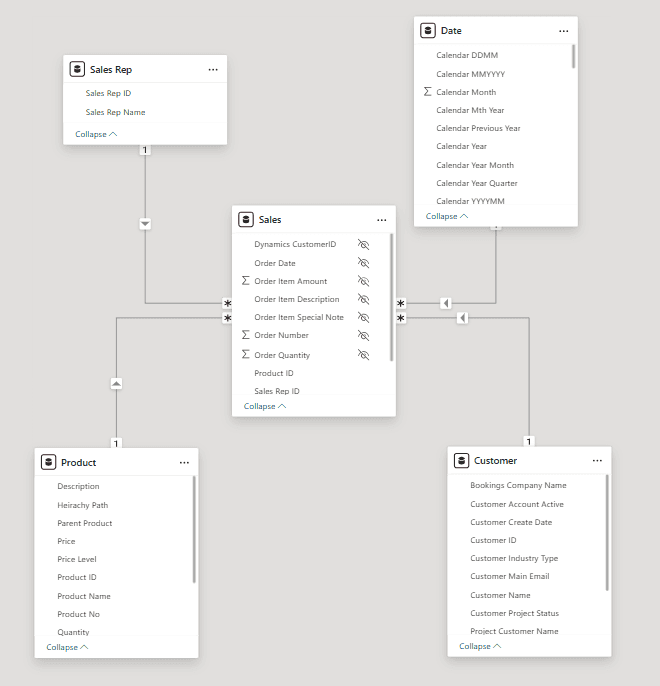
To this more meaningful structure and language:
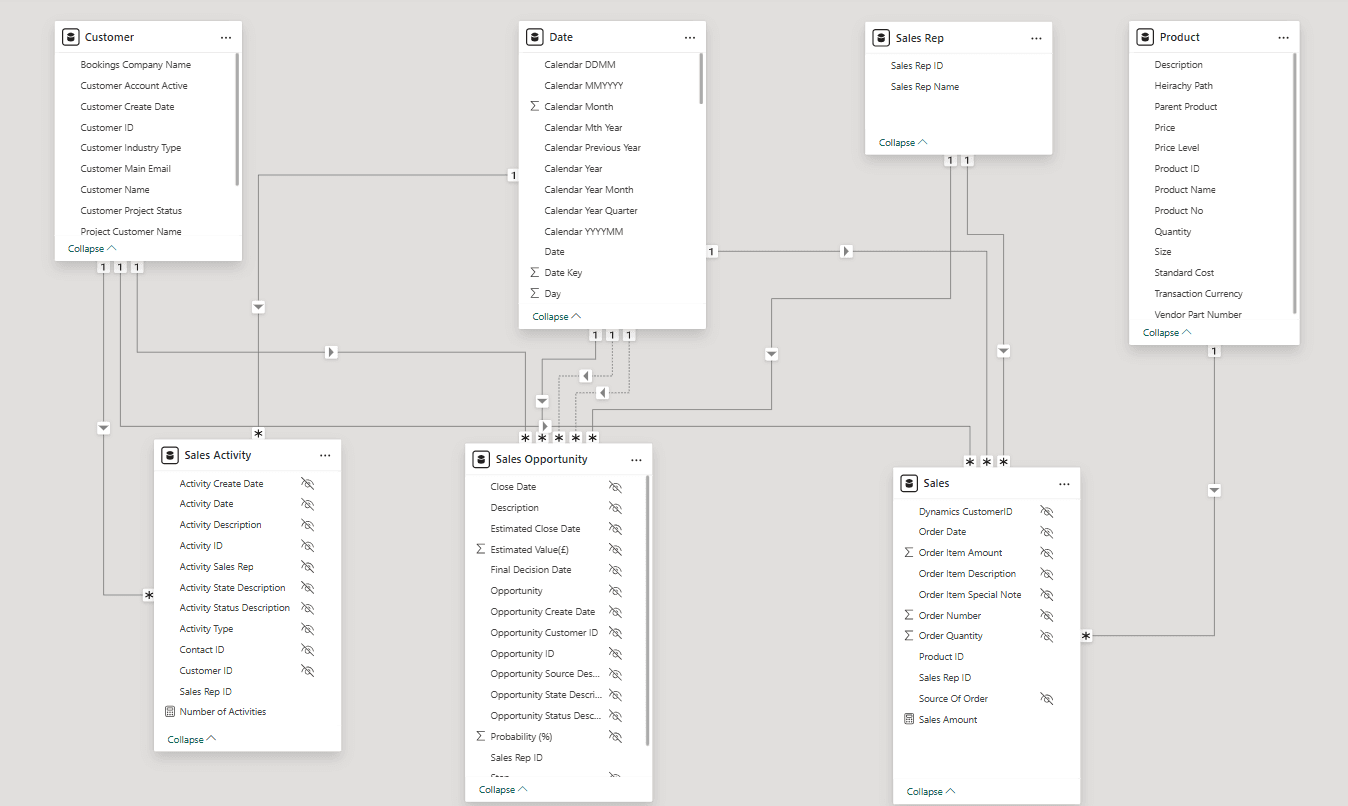
For this example the 17 sources have been shaped into a star schema of 7 tables shown above.
The platform specific language of Dynamics has been transformed into the more subjective business language of Sales Activity and Sales Opportunity and the bookings platform language has been relabelled as Sales. Should a back-end system be changed in the future, for example Salesforce or SAP replaces Dynamics, the model does not need to change and our dashboards are protected from a major rework. All the work is behind the scenes to transform platform specific terminology and structures into our business language and star schema.
In this very crude example of a semantic model we have 4 conformed dimension tables:
- Customer
- Date
- Product
- Sales Rep
These can all be linked to multiple fact tables enabling measures from different business processes to be compared in a single visual.
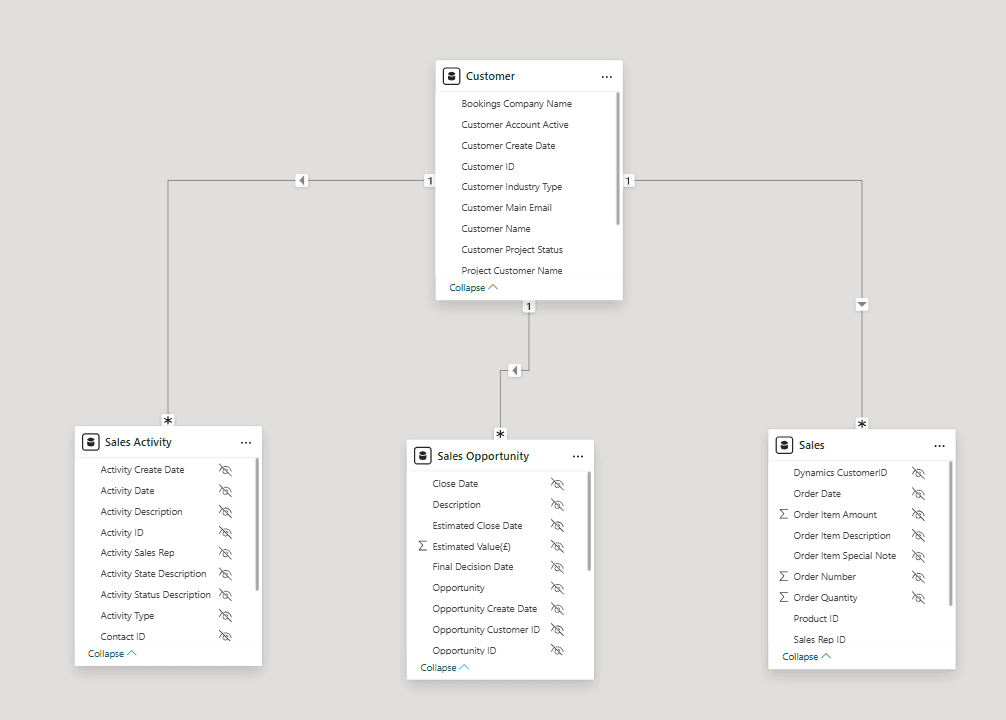
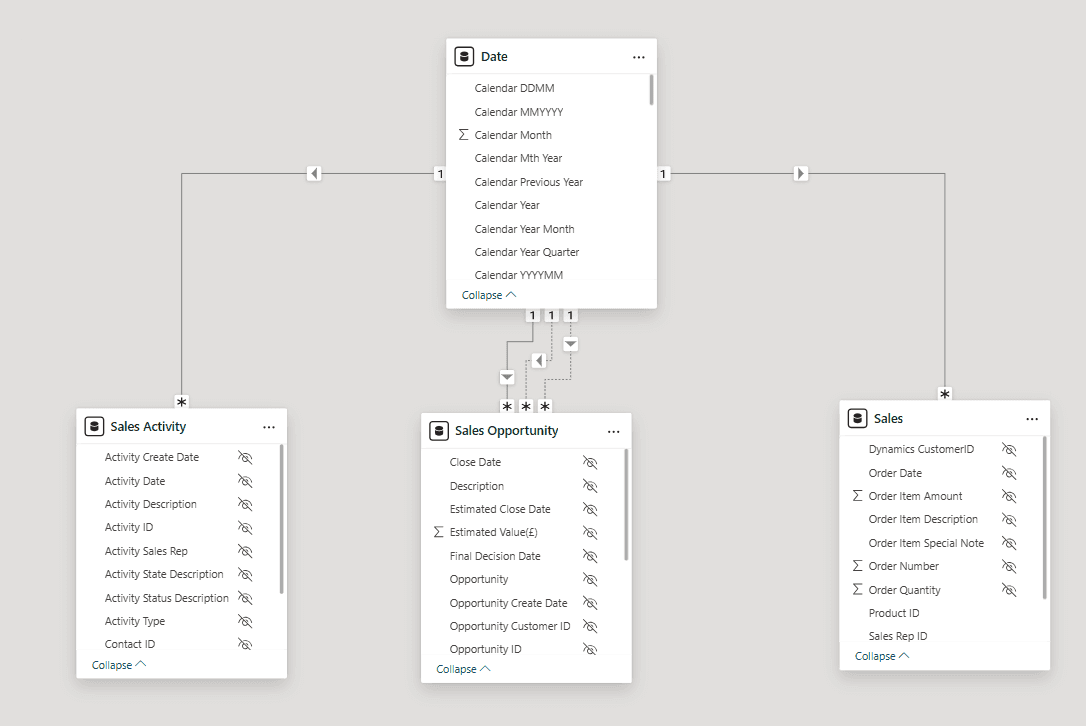
The following stripped back model diagrams may help to show this for the customer and date tables.
Customer Dimension relationships:
Date dimension relationships:
The following diagram shows the star schema for a single fact table a little more easily:
Once the semantic model is in place, building dashboards is a much simpler exercise in a tool such as Power BI:
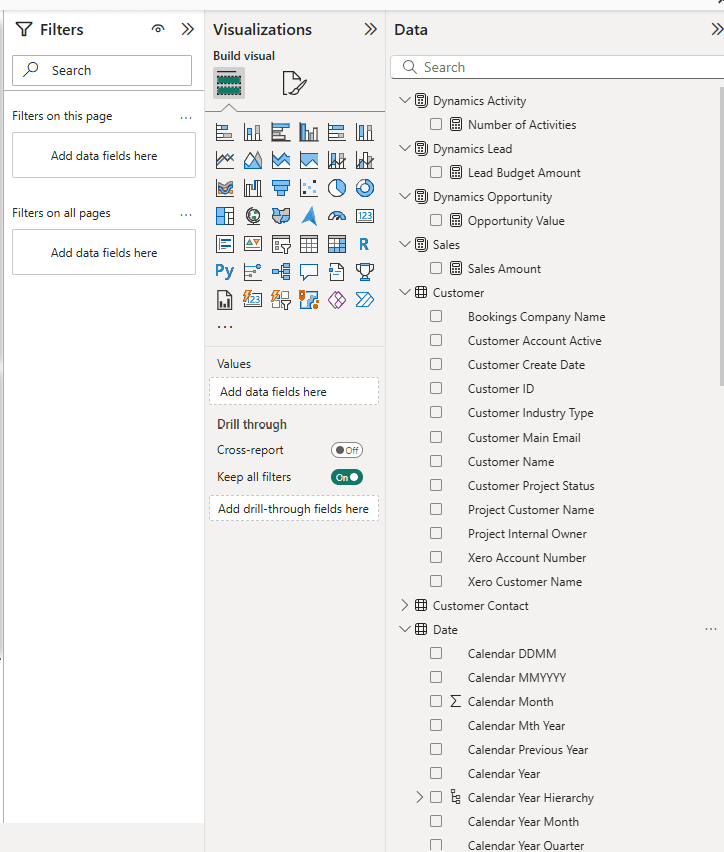
Fields can be dragged from the data panel into visuals without the need of worrying about relationships and formulae - all of that is built into the model.
Step 7: Visualising and Story Telling - the next part of the journey!
The very simple example below shows two charts both presenting sales and opportunity values together, but one by financial year calendar and one by standard calendar.
With just 4 measures created in a model of 7 tables we can start to deliver useful insight into business activities and how they correlate to business success.
As well as the two calendar related charts we have a few score cards showing top level numbers for sales activity, lead value, opportunity value and sales value.
We also have a slicer enabling filtering by the financial calendar hierarchy, year to month to date.
And finally a matrix table bottom right that as well as showing industry types shows how this fictitious business is faring in generating opportunities and closing deals.
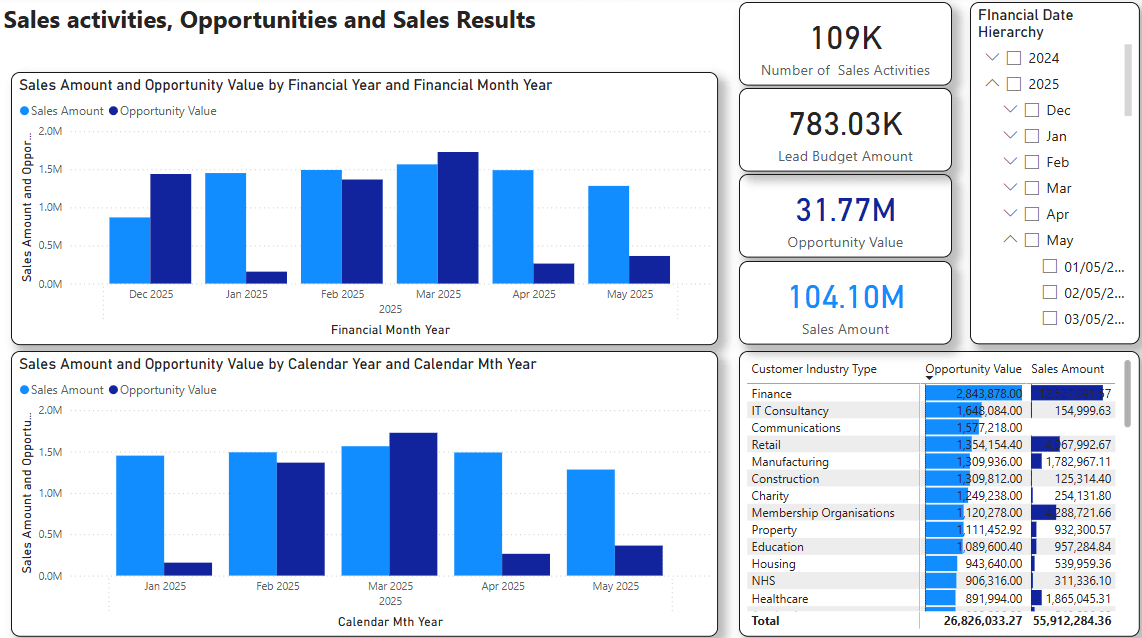
With a well-designed semantic model, authors have a much easier time of putting together insightful dashboards that tell their business stories.
This sample visualisation here is very basic, but with a comprehensive semantic model properly planned, designed and implemented, and a well thought out template for business dashboards, it is possible to build fantastic, interactive dashboards that change how business users interact with their data, ask questions and find answers.
But, perhaps most importantly, your entire business will be working form a single, quality, validated business model and using the same business language across all reports and dashboards to ensure consistency, trust and understanding.
If you need help and guidance in working towards an enterprise semantic model don't hesitate to get in touch as we have an expert team in delivering successful BI and Data Analytics projects from start to finish, and we can ensure that you start with the best strategy for your needs and desires.
- Enquire herePhone: 0118 979 4000
- Email: info@ptr.co.uk
Next month we will be focussing on Visualisations and Story Telling.
MD
Mandy Doward
Managing Director
PTR’s owner and Managing Director is a Microsoft certified Business Intelligence (BI) Consultant, with over 35 years of experience working with data analytics and BI.
Related Articles

Frequently Asked Questions
Couldn’t find the answer you were looking for? Feel free to reach out to us! Our team of experts is here to help.
Contact Us