PTR logo

Data Modelling Consultancy Services

Apply meaning and context to your data

The launch pad for self-service business intelligence and decision intelligence. A well-designed model turns raw, scattered tables into trusted, business-friendly answers, so that every report agrees and every decision stands on solid ground.
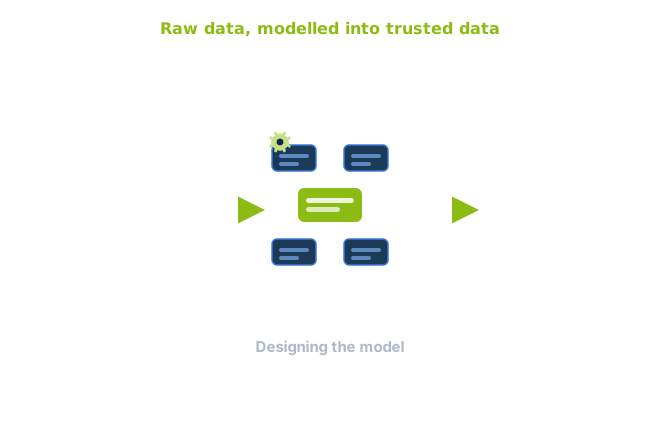

Apply meaning and context to your data
Motion graphic.

What's holding your reporting back?


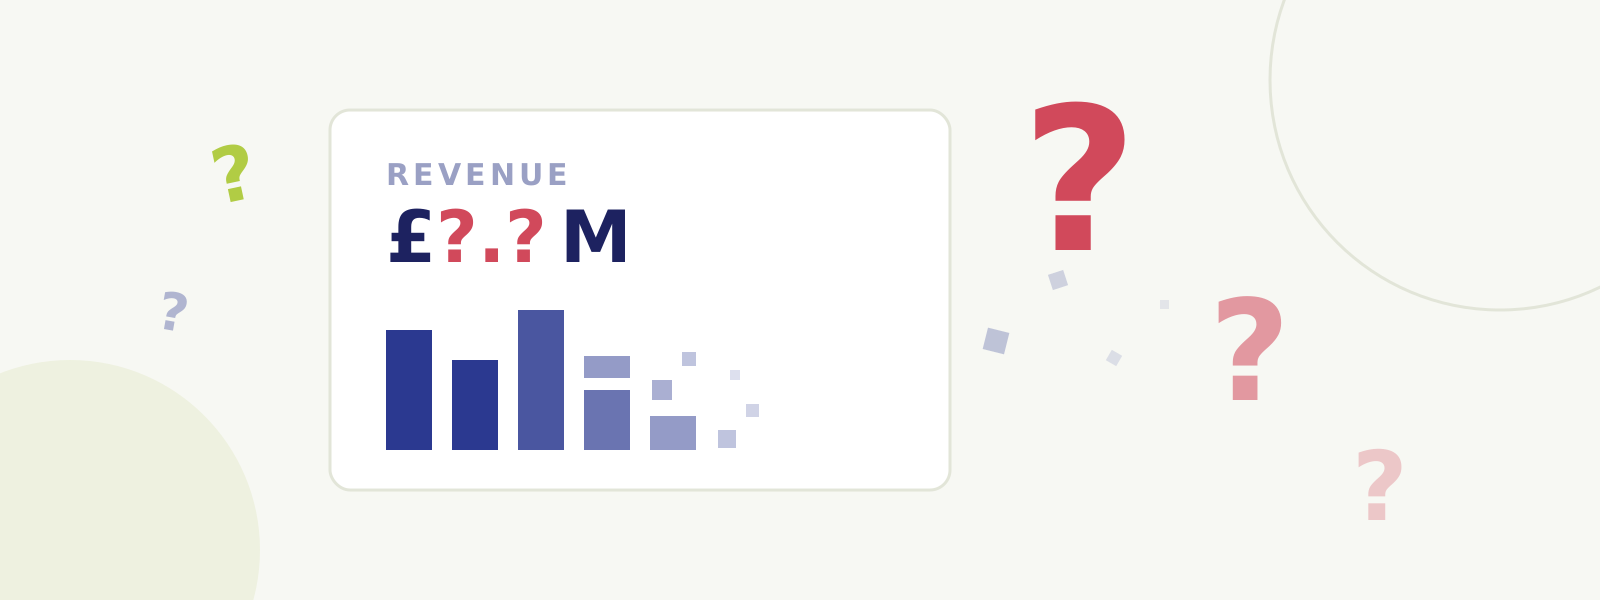
If your data is technically available but still hard to trust, the model underneath is usually the cause. The symptoms tend to look familiar. Reports disagree with one another, dashboards slow down or time out as the data grows and people end up stitching exports back together in Excel to get the number they actually need.
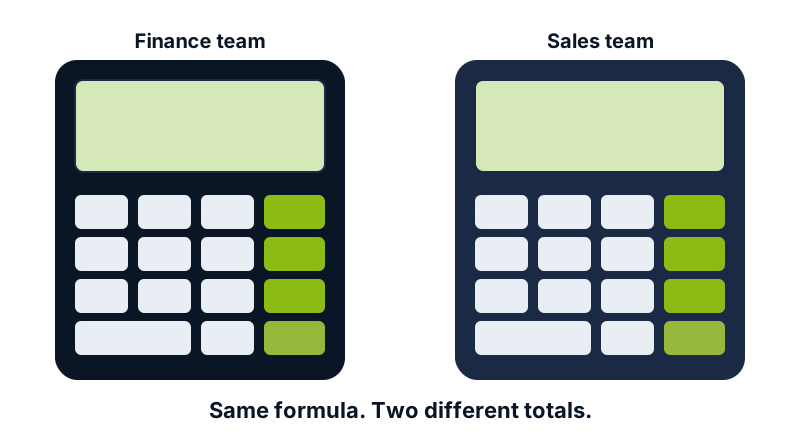
Underneath that, the same metric is often defined differently by every team, there is no agreed definition of something as basic as a customer or revenue and there is no safe way to let people explore the data for themselves. None of these are reporting problems in isolation, they are signs that your data has ineffective modelling.

"Same question, two dashboards, two answers."
Content image

Core modelling concepts


Good business intelligence rests on proven modelling foundations and we design around them rather than reinventing the wheel. At the centre of all is the star schema, where measurable facts sit surrounded by descriptive dimensions, an approach that consistently outperforms a single wide table for both speed and clarity. We build these schemas using Kimball dimensional modelling, working from a bus matrix of conformed dimensions and giving careful thought to the level of detail each fact table records.
From there, the detail matters. Slowly changing dimensions let you track history correctly, so a customer who moves region last year does not quietly rewrite last year's figures. Decisions about normalisation and denormalisation, including the trade-offs of a snowflake design, are made deliberately rather than by accident. Above all of this sits the semantic layer, the place where measures, hierarchies and agreed business definitions live, so that everyone draws on the same meaning.

Modelling in practice


Designing the star schema

We start by fixing the grain of each fact table and building conformed dimensions around it, so that the same metrics line up cleanly across every report rather than drifting apart from one dashboard to the next.

The semantic model and DAX

One governed set of measures feeds every visual, giving the business a single source of truth for the number. When a definition changes, it changes in one place and flows everywhere consistently.
Content image

What you get


The outcome is a documented, governed model that your whole business can trust, supporting dashboards that are faster and more reliable. Because everyone draws on one agreed set of metrics, self-service business intelligence becomes something you can enable safely rather than fear. Just as importantly, a well-modelled foundation is what makes AI genuinely useful, since they can only be as trustworthy as the data they sit on.

"One model. One truth. Every report agrees."


Frequently Asked Questions

Couldn’t find the answer you were looking for? Feel free to reach out to us! Our team of experts is here to help.

Contact Us