
Ideation and Experimentation Consultancy Services
Test the idea before you invest in the build
You have an idea for using data science, but is the insight really there? Before you commit to building a model, we explore your data to find out whether it can answer your question and which opportunities are worth pursuing.

Prove the value first
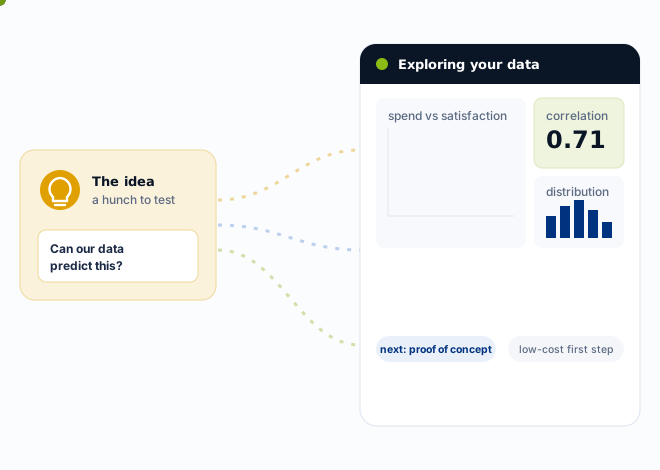
Most data science projects start life as a hunch. Maybe the data sitting in the business already shows which customers are about to leave, or could forecast next month's demand, or flag orders before they go wrong. The instinct is to move straight to building a model to test the theory, but that's a costly way to find out if the hunch was right. Models take time and budget to build, and if the underlying data never had a usable signal in it, a model will only produce confident-sounding predictions that aren't actually worth anything.
That's why we start somewhere smaller. Ideation and experimentation is a short, low-cost first step that treats an idea as something to check, not something to assume. Before any real budget goes near a full build, we run a quick test against your existing data to see whether there's a signal there, how strong it looks, and which of the ideas worth chasing should come first. Testing something costs far less than assuming it — and that's really where any data science project ought to begin.
Common questions
People usually arrive with a question rather than a specification, and the questions tend to repeat themselves:
- Is our data good enough to support AI or machine learning at all?
- Can our existing data solve this problem, or are we missing something we don't currently collect?
- Is there enough information here for a predictive model to be useful?
- Are there hidden trends and opportunities we have never looked for?
- If we have several ideas, which should we prioritise first?
None of these can really be settled in a meeting room. They're questions about a specific set of data, and the only way to answer them properly is to go and look. The point of this stage is to replace opinion with evidence, so that the decision to invest in a model, or to hold off, rests on what the data will actually support rather than on how promising the idea sounds. Whether your data is ready for AI in particular is a question we treat in more depth on our AI Readiness page.





It is far cheaper to test an idea than to assume it.
The first experiment: Exploratory Data Analysis
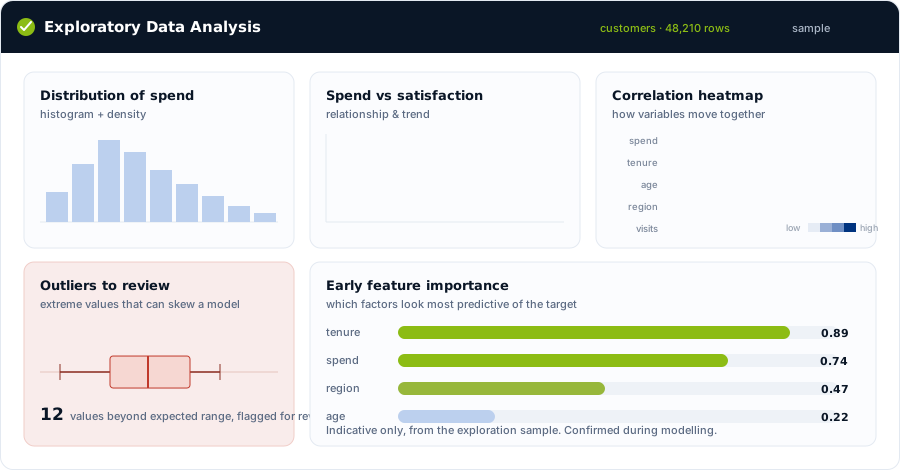
The first step in any data science project is Exploratory Data Analysis, or EDA, and its job is to understand a dataset properly before a single line of modelling code is written. We work through the data to learn its shape and character and how complete it is, to surface the patterns hiding inside it that nobody has had cause to look for, and to detect the anomalies and outliers that quietly skew models later, so they are understood at the start rather than discovered halfway through a build.
EDA is also where assumptions get tested against reality. Do happier customers really spend more? Does the season genuinely move sales, or does it just feel that way? Which measures move together, and which are independent? Answering these early tells us whether the relationships the idea depends on actually exist in the data, and it means the time and money a machine learning project needs is only committed once there is real evidence to justify it.
How we explore your data
Exploration is part statistics and part visualisation, and the two work in tandem: the numbers tell us what is there, and the pictures make it obvious.
In the numbers
- How the data is spread, and how much it varies
- The shape of each distribution, and whether it is skewed
- Correlations between each factor and the outcome you care about
- Outliers that would quietly distort a model
- An early read on which features look most predictive
- Whether a pattern is significant, or just noise in a sample
In the pictures
- Box and density plots for how one variable behaves
- Scatter plots and heatmaps for how many relate at once
- Maps, where the question is geographic
- Segments that group customers into natural clusters
- Time views that expose seasonality and drift
A chart makes a trend or an imbalance obvious in a way a table of figures rarely does, so the aim throughout is simple: see clearly what the data is telling us before committing to build anything on top of it.
What the experiment tells you
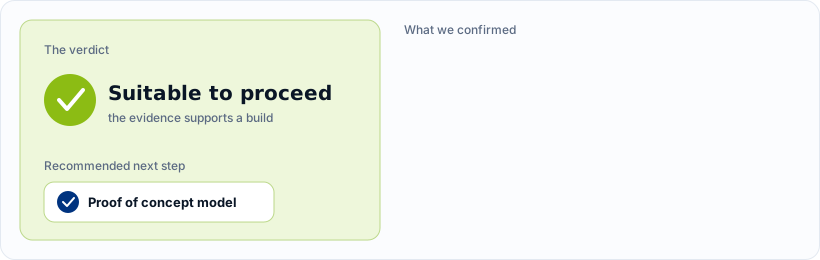
The result is a clear verdict on whether your data is suitable for the data science project you have in mind. You come away knowing:
- Whether the signal is really there, with early evidence of the patterns and relationships that were found
- Which of your opportunities look the most promising to pursue, ranked in order
- Whether there is enough variation in the data for machine learning to add anything
- Whether the target you want to predict actually exists in the data and has been recorded consistently, because a model can only learn an outcome that has been captured reliably
Where the exploration turns up obvious data quality problems, we say so plainly and point to what would need fixing first, work we cover on our data validation page. Every engagement ends with a recommendation and a suggested next step, whether that is to proceed to a proof of concept model, to collect or clean particular data before going further, or to set an idea aside because the evidence is not there. In short, this stage tells you whether the available data is likely to support a solution that delivers real business value, before you spend to find out.
You find out whether the insight is really there before you pay to build on it.
Where do you start?
We keep this first stage small and quick on purpose, so you get a clear answer without a long commitment. It begins with the question you want answered and the measure of success behind it, then works forward through the data to a verdict you can act on.
Frequently Asked Questions
Couldn’t find the answer you were looking for? Feel free to reach out to us! Our team of experts is here to help.
Contact Us