
Use Cases
How to open up SAP reporting to the business with Power BI
PTR has done this before: a Power BI semantic model over SAP data in business terms, so people across the business build and explore their own reports on the web and mobile.

Published · Updated
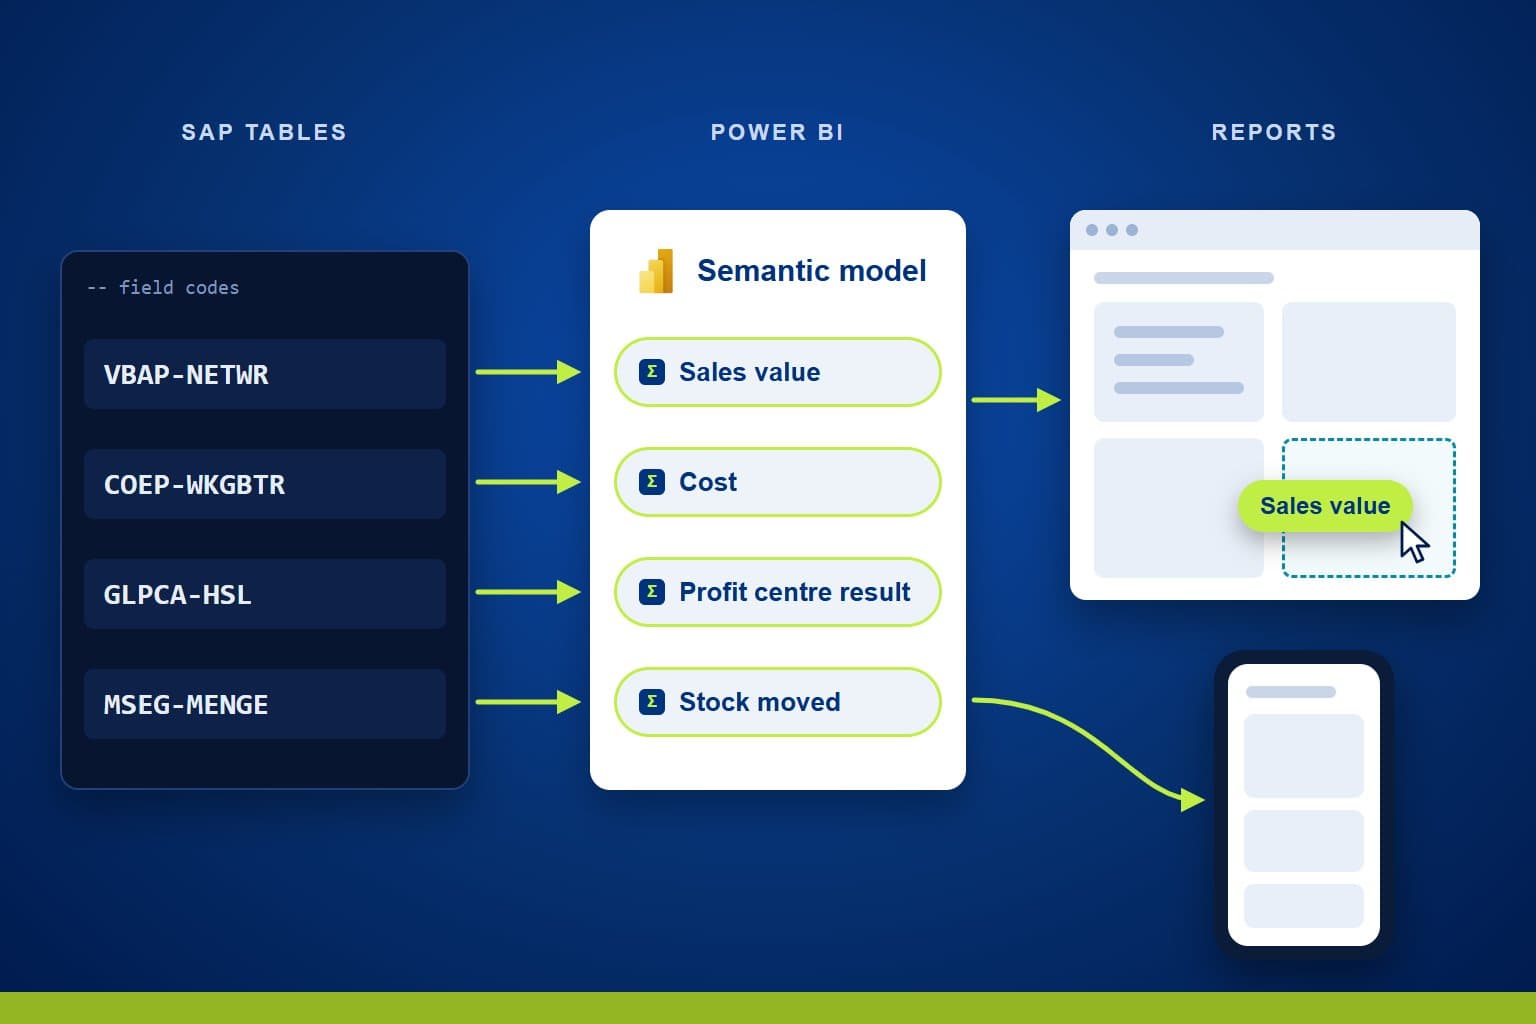
SAP holds the figures a business runs on, but its tables are built to process transactions, not to answer questions. PTR can build a Power BI semantic model over SAP data, set out in business terms, so people across the business can open, explore and build reports themselves. We know how to cut through the noise in SAP and get to figures people can use.
The Challenge: SAP data that only specialists can report on
SAP stores its data in technical tables with coded field names, and the largest can run to billions of rows. Turning them into a report takes someone who knows both SAP and the reporting tools. So reports are built on request, as fixed layouts that are slow to change and awkward to explore. Use falls away, and teams start their own reports in pockets, each with its own version of the figures.
Teams need to be able to:
- See SAP figures in the terms the business uses
- Build their own reports without querying SAP tables
- Filter, explore and drill into the detail
- Open reports in the browser, in SharePoint and on a phone
- Trust that everyone is using the same definitions
What PTR has built: a semantic model in business terms
We have built a Power BI semantic model that sits between SAP and the people who report on it. It brings sales order items, controlling postings, profit centre actuals, material movements and profitability data into a star schema. Field codes become names people recognise, and the measures and KPIs your business uses are written once, in DAX, inside the model.
Report authors then drag those fields and measures onto a page, with no SQL and no knowledge of SAP tables. The model is shared and certified, so every report built on it uses the same definitions. Readers open interactive reports in the browser, in SharePoint or in the Power BI mobile apps, signing in with their Microsoft Entra ID work accounts.
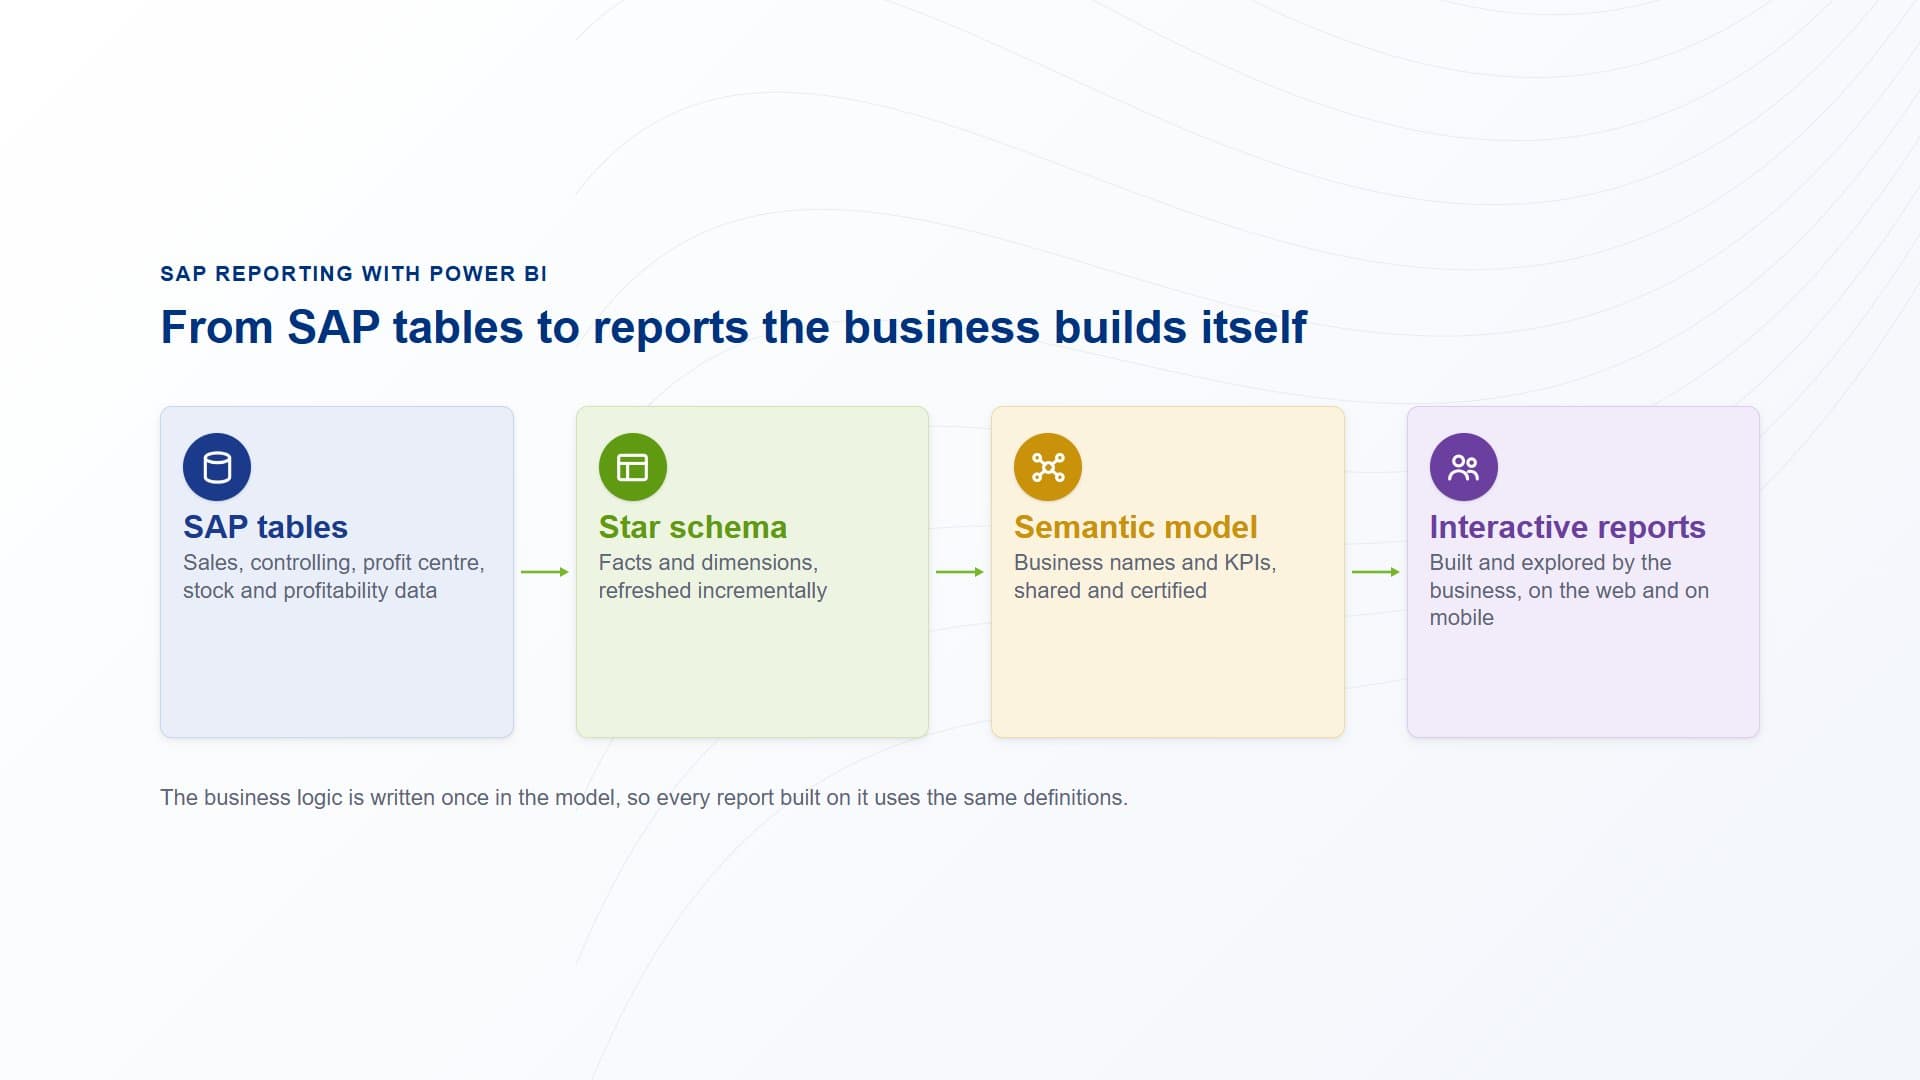
SAP tables are shaped into a star schema and a semantic model in business terms. People then build and explore their own interactive reports, on the web and on mobile.
Why PTR: we have done this before
SAP projects stall on the same few problems: too many tables, field names nobody outside the SAP team understands, and measures that differ from one report to the next. We have worked through them, in Power BI, over SAP data. We know which tables a business reports on, how to shape them, and how to keep the model fast and the definitions in one place.
That experience saves you the trial and error. You get a model built by a team that has done it, and training that leaves your own people able to build on it.
How PTR builds it: from SAP tables to self-service reporting
Shape the SAP data
We take the SAP tables the business reports on and shape them into a star schema of facts and dimensions. Incremental refresh reloads only recent data, and aggregations hold summaries in memory, so reports over very large tables respond quickly.
Build the model in business terms
We name tables, fields and measures in the language your teams use, and write the KPIs once in DAX. Composite models let report authors extend the shared model with their own data, without copying it.
Set up workspaces, templates and apps
We set up development, test and production workspaces, so changes are checked before people see them. Report templates and guidelines give every report the same look, and Power BI apps deliver finished reports to each audience.
Train users and authors
We run introductory Power BI training, then DAX and visualisation workshops for report authors. Super-user groups follow, so each team has people who can help colleagues and build new reports.
What it gives your teams: SAP reporting the business can use
- SAP data in business terms:people work with names and measures they know, not table and field codes.
- Reports people build themselves:authors drag fields from a certified model, instead of waiting for a report to be written.
- Reports on the web and on mobile:interactive reports open in the browser, in SharePoint and in the Power BI mobile apps.
- One set of figures:every report draws on the same shared model, so a measure gives the same answer wherever it appears.
In practice, a sales manager opens a report on their phone, filters this month's orders by region and drills into the order lines. The figures match the finance team's, because both come from the same model.
Our view: SAP holds the data; Power BI should make it readable. We have done this before, and we know what to model, what to leave out and how to get people using it. Model it once in business terms, and the reporting can move to the people who need it.
Open your SAP data to the people who use it
Move SAP reporting out of the specialist queue. Talk to us about a Power BI semantic model over your SAP data. PTR provides consultancy, training and support in Power BI, DAX and data modelling.
Call 0118 979 4000 or Email info@ptr.co.uk.

Frequently Asked Questions
Couldn’t find the answer you were looking for? Feel free to reach out to us! Our team of experts is here to help.
Contact Us