
Tech Tips
Use case – Retail Data Analytics Solution Using Microsoft Fabric
Our customer had a very common problem. Manual processes being used to export data from various systems & bring them together meant daily reports took days to prepare. How could a well-designed modern analytics system help?

The Problem
Our retail customer had a very common problem. The manual processes being used to export data from various systems and bring them together meant that compiling daily reports took days. Decisions were being delayed and latest figures were often left out. How could a well-designed modern analytics system help? Read on to find out.
The Requirement
Our retail client makes use of several well-established online services to fulfil the following:
- Order & stock management
- Point of Sale
- Buying
- Purchase Order Processing requirements both online and in store
- Marketing & Customer Acquisition
- Inventory & Stock Management
- Delivery & Logistics
- Customer Service
Valuable insights were hidden in their disparate applications and data sources, and they needed help in unifying their valuable datasets into a Single Source of Truth so that they could improve accuracy, efficiency, trust and user engagement in their data analytics and reporting world.
Core solution technical requirements for this project included:
- Integrate data from their many business applications for a business wide view
- Streamline current manual data collection and preparation
- Provide richer, more compelling and interactive reports
- Provide a “One Truth” standardized set of key business metrics
- Spend more time analysing data than preparing data
Core delivery requirements for this project included:
- Training
- Mentoring
- Stakeholder Engagement
- Needs Analysis
- Data Discovery
- Solution Architecting
- Solution Implementation
- Support
Technical Requirements
The manual processes being used to export data from various systems and bring them together meant that compiling daily reports took days. They were using a mix of complex spreadsheets, CSV files, independent databases and numerous reporting tools that had been adopted by different parts of the business over time, with key dashboards rarely available on time, or missing data when they were published. This was leading to difficulties in making informed business decisions.
Their mission was to automate as much as they could, to minimise the amount of human intervention required to gather, integrate and model business data, and to have reports and dashboards available whenever they needed them.
They wished to streamline the process for collecting and preparing distributed data so that they could reverse that time balance between human effort to prepare and human effort to analyse.
They asked for our help with identifying what they could achieve with a rapid return on investment, a rapid user adoption, and an affordable path to an enterprise solution. They looked to us to help with selecting the right platform and toolset for the job, architecting a solution, mapping out a timeline to deliver an enterprise BI and Data Analytics solution, and assist with implementing and delivering the chosen solution.
A key objective was to use the latest technology and modern approaches to building a future-proof, central repository to deliver shared dashboards to a wide audience in a secure, performant and maintainable way.
They also wished to significantly improve the trust of users in the quality and reliability of reports and dashboards. Current manual methods have historically led to errors and inaccuracies leading to poor quality data and a mistrust across the business, in turn leading to poor user engagement and a reluctance to adopt any “new” reporting solutions.
A key requirement was to deliver higher quality, “wow factor”, compelling and interactive reports – a big step up from a largely Excel and paginated report style of reporting currently being delivered.
Delivery Requirements
Initial stakeholder engagement sessions were carried out as a part of the early solution design phase of the project with an introduction to data driven decision making culture and its business benefits. We also planned needs analysis and data discovery sessions to fully capture the BI requirements across the company.
Training was to be provided to their BI team, key stakeholders and users to ensure maximum user engagement and ensure the success of the project.
It was very important to our client that their internal data team was trained and mentored throughout the project to ensure they understood and could support the new BI solution going forward, and work towards being self-sufficient.
Training, in general, was an important part of the client requirement from overview sessions introducing data driven decision making across the business, relevant technical training, report and dashboard design skills, and user workshops to train dashboard and report consumers in how to work with interactive dashboards to get the most out of them.
Business Challenges
The Retail industry faces many challenges when it comes to making effective use of their data. When we consider the applications and services required in the modern day to keep a retail business operational they are numerous, for example:
- POS
- E-commerce
- CRM
- Supply Chain
- Marketing
- Marketplaces
Data is distributed across many systems which can be difficult to relate:
- Common business objects such as Customers and Products have different identities in different systems
- There is no single view of a customer or product or other such business entity that spans all systems to pull all attributes into a single record
- It is difficult to create links between activities such as sales to customer v marketing campaigns to customer, or sales v complaints, sales v returns
With data being distributed across multiple operational systems comes the added challenge of data ownership and data intelligence, meaning that many business units and people share the core knowledge needed to bring all this data together in a meaningful way.
- Merchandising
- Operations – Store and Supply Chain
- In-store Operations
- Supply Chain, Logistics and Warehousing
- Sales and Customer Service
- Marketing and Advertising
- Human Resources
- Finance and Accounting
Previous BI projects had not gained the desired traction, with low user trust and adoption, so for this project the client was keen to involve stakeholders from the start to ensure the success of the project and win back the trust and engagement of both stakeholders and users.
The Solution
The final solution for this project was designed around the Microsoft Fabric and Power BI platform.
The Technical Solution
The infrastructure incorporated a Microsoft Fabric hosted Lakehouse approach implementing a Medallion architecture design with Bronze, Silver and Gold Lakehouse layers.
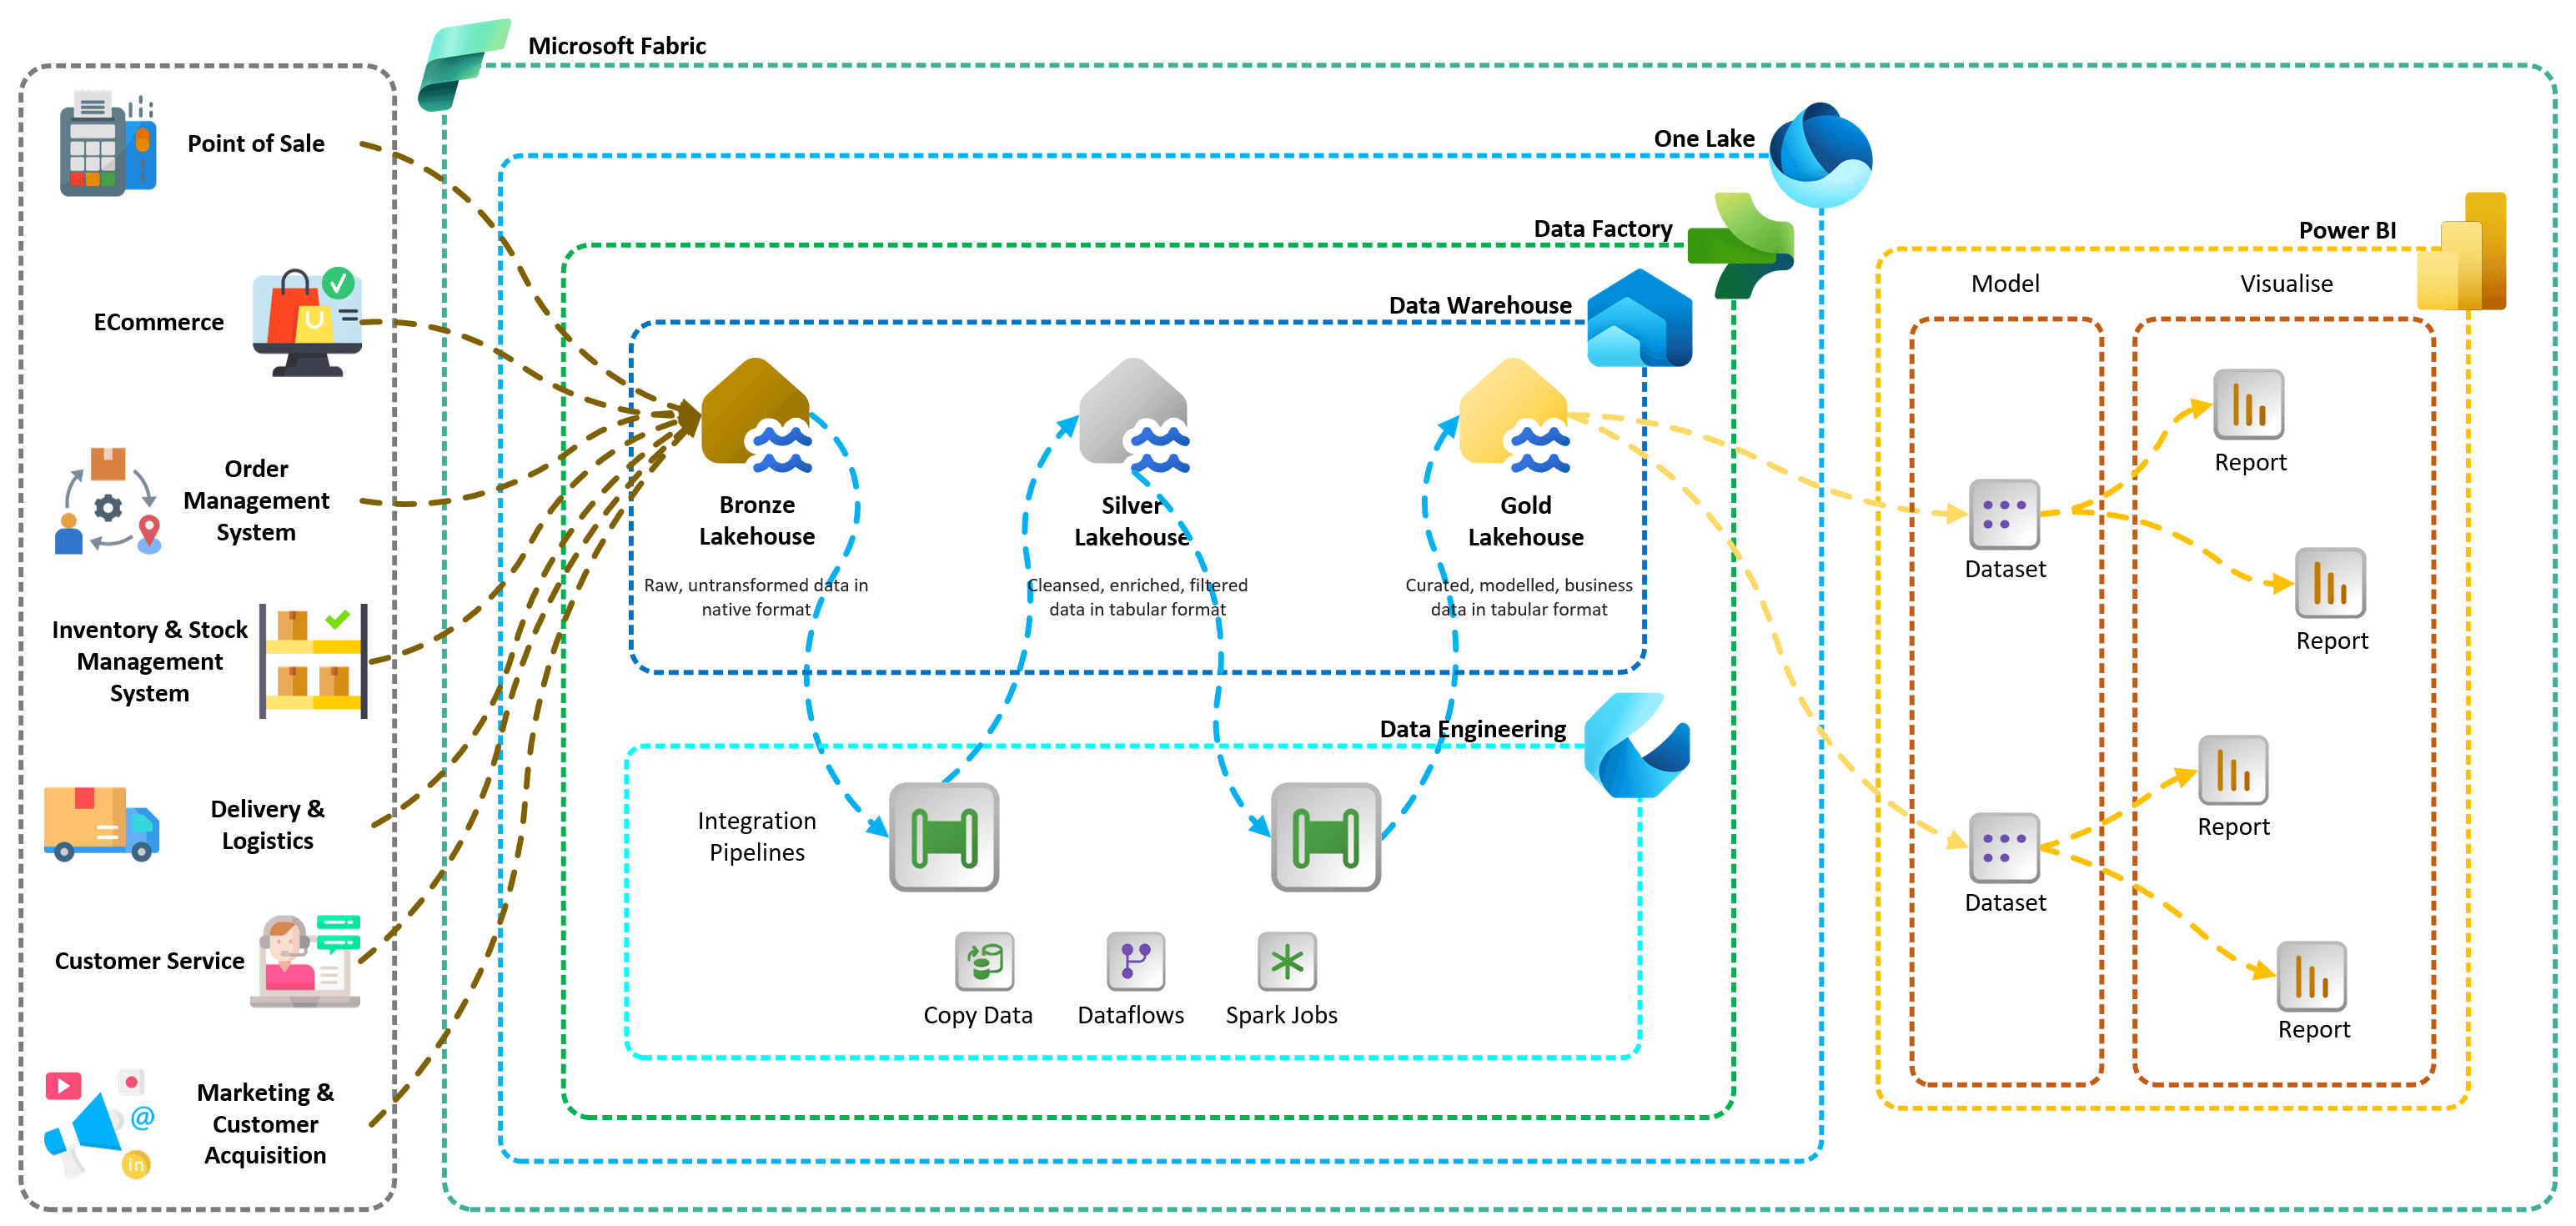
All data ingestion pipelines were handled through Microsoft Fabric Data Factory pipelines.
Microsoft Power BI was selected as the reporting platform.
A shared Semantic Model providing a common Data Dictionary and standardised Business KPIs was developed and hosted in Microsoft Fabric.
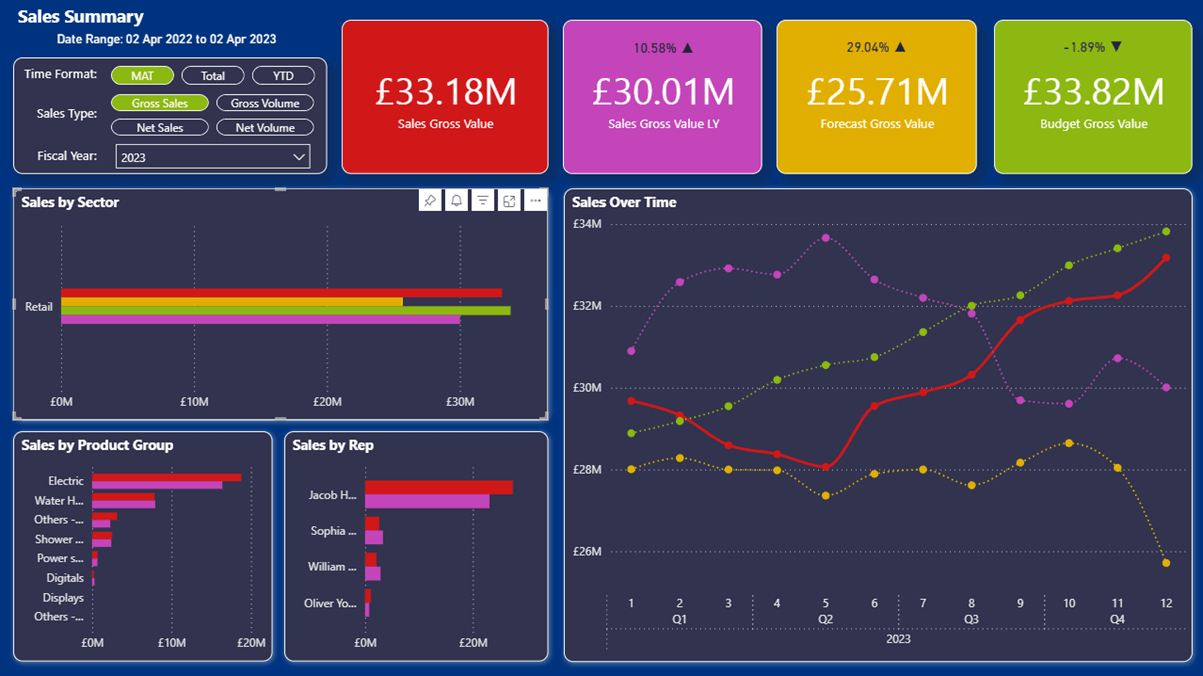
Template dashboards were created for a prioritised business reporting and analytics requirement. Sales Performance was chosen as the first
A suite of carefully designed Power BI dashboards were published into Power BI with secure access given to the relevant users.
The Delivery Solution
An initial Data Strategy exercise was undertaken to comprehensively explore the key characteristics of collected source data, and how this aligns with their reporting and business intelligence aspirations to identify the most appropriate technical platform and usage patterns to satisfy these goals.
A Data Landscape Audit was carried out to review source application data, current infrastructure, and business needs
An implementation plan was drawn up outlining a suitable repository platform, key phases of delivery, expected licensing and resource consumption costs, and required technical expertise and upskilling requirements.
Stakeholder briefings were held with key Business partners before any data ingestion or business modelling was undertaken to ensure all current and future requirements had been captured, and to ensure the final repository and semantic model were fit for purpose, future proof, and eliminated all unnecessary duplication of business data.
A Data Dictionary was created, capturing all key business terminology and metric definitions identified by Business partners, and identifying all conformed and shared business objects such as Region, Store, Customer, Product, Calendars, Seasons.
Business processes and associated dashboards were prioritised and tackled in a modular manner with achievable milestones defined to deliver an end-to-end suite of dashboards in an acceptable time frame and within budget constraints.
Raw untransformed data was ingested into a Bronze Lakehouse, which was then cleansed, enriched, filtered and transformed into quality tabular formatted data hosted in the Silver Lakehouse.
A Single Source of Truth dataset was then constructed in the Gold Lakehouse, offering curated, modelled, business data in a tabular format and ready for consumption by reports, dashboards and Data Science tools.
Training was provided to the internal BI team who would be supporting and maintaining the infrastructure, lakehouses and semantic model.
Training was provided to report and dashboard creators to equip them with an understanding of the semantic model, and provide skills in creating insightful, interactive dashboards.
On-going support was provided and is provided to the internal team to continue the growth and development of this project.
So there you have it. Complex retail challenges tackled via a thorough thought-out data strategy, backed up with consultation and training.
If you’d like to have a play around with this project then you can find an interactive version at the bottom of our home page here https://www.ptr.co.uk/ Dive in and give it a go! Dashboard design is of course customisable to your exact needs. And if you are tempted to find out more then please do get in touch via our contact page.
MD
Mandy Doward
Managing Director
PTR’s owner and Managing Director is a Microsoft certified Business Intelligence (BI) Consultant, with over 35 years of experience working with data analytics and BI.
Related Articles
Frequently Asked Questions
Couldn’t find the answer you were looking for? Feel free to reach out to us! Our team of experts is here to help.
Contact Us