Tech Tips
Top 5 BI Business Benefits for Retail
Retail businesses face a lot of challenges that threaten efficiency and profitability but did you know that many of them can be significantly improved or even eliminated by an effective Business Intelligence and Data Analytics solution?


Tackling Retail Business Challenges with BI
Retail businesses face a lot of challenges that threaten efficiency and profitability but did you know that many of them can be significantly improved or even eliminated by an effective Business Intelligence and Data Analytics solution?
We’ve decided to focus on just 5 of them:
- Benefit 1: Improved Demand Forecasting
- Benefit 2: Better Visibility of Sales Performance
- Benefit 3: More Efficient Stock Management
- Benefit 4: Increased Understanding of Customer Behaviour
- Benefit 5: Better Visibility of Promotion and Pricing Impact on Profitability
- How Do We Do It?
- Summary
Retail Business Data Challenges
The challenge that troubles you the most will ultimately depend on the size and character of your business, and where you’re starting from. When there are no specific Business Intelligence skills in-house, BI projects may exist, but they can be disjointed or implemented in isolation from one another.
Many retail businesses already have good reporting but might be struggling to get the reports produced in time for key meetings where they’re needed for decisions. This is often the case when a lot of different purpose-built applications are being used across various business sections, resulting in isolated and disjointed sets of data or data silos. This makes it very hard to get a total view of the whole business.
Another issue is the frequent stand-offs between IT and Business with business needing quick results to drive better decision making and IT needing to ensure that all tech stack solutions follow their data strategy guidelines. IT will be thinking about issues like whether platforms are supportable, whether they adhere to security and data governance policies, and whether they risk driving operational systems into overload with excessive calls to retrieve data.
When departments work independently of IT data people often use Excel and other tools to bring the data together. Users locate the data they need, exporting it from various live systems to CSV files and cobbling it together through a mix of supporting lookup and mapping tables. But data is out of date the minute it is exported and the grain and format of the data is very much dictated by the particular tool and even the person defining the export. This can mean lack of consistency.
There is often minimal or no cross department communication to define common requirements and definitions, resulting in much confusion. Core KPIs (Key Performance Metrics) built independently by different business units using complex Excel formulae might be different from one department to the next.
For example, how many different definitions do you have across your business for;
- Sales revenue
- Like for like store sales
- Gross margin
- Customer conversion rate
- Inventory turnover
- Sell through rate
- Customer retention rate
- Net promoter score
- Customer acquisition cost
- Out of stock rate
With so many different performance metrics and data dictionaries describing your common business terms, people risk coming to meetings with completely different sets of figures. That leads to confusion, misunderstandings, mistrust and poor decision making.
So let’s take a look at 5 key areas where organised data systems and a defined Business Intelligence plan can help you.
Benefit 1: Demand Forecasting – Required data Inputs
Demand forecasting helps to ensure product is in the right place at the right time, so that when a customer wants a product they can buy it. All retail businesses want to ensure that sales equals demand. If sales are less than demand for whatever reason, a customer can’t buy what they want and a sale is lost. Perhaps it was in the warehouse, but not in the store, or maybe it was in a different store. Perhaps it was in stock but was damaged. Perhaps it is in stock, but we don’t have enough of them.
For accurate demand forecasting we need to have visibility over many things, including data from some or all the following:
- Historical sales data – units sold, revenue, daily/weekly grain
- Product attributes – category, brand, size, colour, style, price, lifecycle (core, new or discontinued)
- Pricing and promotions – list price, sale price, promotion type, duration, coupons, bundles, offers, loyalty offers
- Inventory and availability data – on-hand inventory, in-stock/out-of-stock flags, backorders, substitutions
- Channel and store data – store location, layout and size, channel type, local trading trends
- Customer loyalty – repeat v new customers, basket content, loyalty segmentation
- Calendar and seasons – holidays, events, payday, week and day of year impact, retail events such as back to school or university, Christmas
- External data – weather, local events, economic indicators
Some of the data which influences demand forecasting are external such as weather forecast information. But much of it comes from different business units such as:
- Merchandising
- Operations – Store and Supply Chain
- In-store Operations
- Supply Chain, Logistics and Warehousing
- Sales and Customer Service
- Marketing and Advertising
- Finance and Accounting
To successfully improve the accuracy of our demand forecasting, we need data from all these business areas.
Demand is impacted by:
- Marketing, advertising and social media campaigns which result in increased purchases
- Product being in stock in stores or online for customers to buy when they want it
- Seasonal events such as Easter and Christmas driving higher sales in chocolate, flowers, toys and other gifts
- Holiday seasons driving higher sale of warm weather or cold weather clothes, camping gear, outdoor gear
- Pay day dictating when consumers have money available to buy the things they want
- Weather events such as heavy rain and heatwaves driving purchases of things like umbrellas, wellingtons, waterproofs, sun cream, fans, air conditioning units
- Local events such as roadworks and festivals driving sales down due to access issues, heavy traffic, parking issues. Or driving sales up due to increased footfall
- Store location and layout affecting the consumers experience and impacting whether they buy or don’t buy – can they find what they need? Was the shop warm? Did the shop smell nice?
- Customer experience in a Bricks and Mortar store, or in an online store. Good service can drive an increase in sales. Poor service may result in no sale.
To maximise profitability, we need to bring all the relevant data sources together so that we can link our historic sales data to seasonal patterns, marketing campaigns, social media trends, store condition and user experience.
A well-designed and well-implemented BI solution can bring together all the relevant demand forecasting data to drive more accurate demand forecasting in a timely manner.
Benefit 2: Better Visibility of Sales Performance
Sales Performance encompasses:
- What is selling?
- Where is it selling?
- Why is it selling?
- How profitable is it?
Some of the core KPIs that drive visibility of sales performance in the retail world include:
- Top line sales – overall performance and sales growth
- Total Sales Revenue – by region, channel, store, product, product category, by year, month, week, day
- Like for like sales growth – exclude outliers such as closed or new stores, new or discontinued products to get true growth or decline
- Sales per square foot – Store and location productivity
- Sales per employee - Staffing productivity and levels
- Conversion rate – transactions v footfall, online orders v online sessions
- Average Transaction Value (ATV) – Average item value
- Average Order Value (AOV) – Average order value
- Units per Transaction (UPT) – pricing v volume relationships
- Sell Through Rate – Units sold v units received
- Top/Bottom Product and Category performance – sales and growth contribution to identify popular stock and dead stock
- Channel and Omnichannel performance – store v online v marketplace, channel shift, buy-online-pickup-in-store (BOPIS)
- Markdown rate – discounted sales v total sales
- Promotional Sales Uplift – sales v sales baseline
- Gross Margin – by product, channel, store
- Contribution margin – sales minus variable costs including discounts, fulfilment and returns
Once again, a lot of data is needed to calculate these KPIs.
Sales data is generated in a number of operational systems:
- POS
- E-commerce
- Marketplace
It is also fragmented across different regions and countries, who have different currencies and different tax rates.
In many cases one business may have acquired another, and with that may have inherited numerous variants of POS and e-commerce platforms and systems.
This can make it very challenging to bring all sales related data together.
Not only will we need to bring all the data together with all the challenges that relating data from different systems brings, but we will also have to handle:
- Choosing a base currency to work in
- Handling foreign currency exchange rates – average day rate, end of day rate, consolidated rate
- Handling tax – deducting tax at the right tax rate where systems expose gross figures rather than nett figures
A well-designed and well-implemented BI solution can bring all sales data into a single view enabling sales to be tracked by channel, store, product and time. This in turn allows us to create dashboards that answer the key questions every business wants to know, such as;
- Are we growing?
- Where is growth coming from?
- Are we profitable?
- What does our sales trend over time look like?
- What does our channel and store performance look like?
- Where do we need to focus our attention?
Benefit 3: More Efficient Stock Management
Stock Management or Inventory Management is about ensuring stock is in the right place at the right time, and that we are not overstocked. Challenges we face with stock and inventory management include:
- Overstocking – Inventory turnover too slow, aging stock that becomes obsolete, unsaleable or must be marked down
- Understocking – Product not available for demand, missed sales
- Inaccurate demand forecasts – results in overstocking or understocking
- Replenishment levels not adequate for demand – fixed ordering quantities regardless of season, campaign or trends
- Stock in the wrong place – disconnected warehouse, store and e-commerce inventory
- Poor inventory allocation – equal quantities to all stores rather than following store trends, newer stock moved before older stock leading to shelf-life challenges
- Shrinkage, Loss and Inaccuracy – reduced stock items due theft, damaged goods, misplaced goods and administrative errors
- Cash flow impact – cash tied up in stock that isn’t selling at the expected rate
Overstocking results in cash being tied up in stock and potential cashflow challenges, where understocking means we cannot meet demand. You can see there is an overlap here with demand forecasting, as we need to know what the likely demand is to have a chance of getting stock management right.
Not only is understocking going to hit our immediate sales performance, it can lead to customer dissatisfaction and lack of trust, leading them to do their shopping elsewhere, not just now but for the longer term.
Theft and damaged stock not only leads to effective understocking but is also a big threat to our profitability.
Stock sitting in the warehouse when it should be in a store, or stock quantities that do not meet supply needs will lead to frustration for a store manager who cannot fulfil customer demand due to stock shortages. Where individual performance is measured by store performance this is a frustrating issue.
Stock replenishment which does not take into account regional, store and channel trends or ignores varying demand can lead to dissatisfaction amongst both staff and customers where product is unavailable when they need it.
It is extremely hard for a retail business to get all their stars aligned – that is; their marketing messaging, their store layouts, their staff training, all in such a way that wins the confidence and business of consumers. It can take a very long time to achieve. Imagine then that you discover the stock is not available when and where it is needed - all that time and money has been wasted. A sale is not real profit until it is sold, delivered and paid for.
Common KPIs for driving inventory visibility and decision making include:
- Inventory Turnover – cost of goods sold v average inventory
- Days Inventory on Hand (DOH) - average inventory cost v average daily cost of goods sold
- Weeks of supply (WOS) – Inventory on Hand v Weekly Demand
- Sell-Through Rate – units sold v units received
- Inventory productivity (GMROI) – gross margin v average inventory cost
- In-stock Rate – Time product in stock v total time in period
- Stockout Rate – Out of stock events v total product/store combinations
- Fill Rate – unites delivered v units ordered
- Inventory Record Accuracy (IRA) – (System quantity minus physical quantity) v physical count
- Shrinkage Rate – (Book inventory minus physical inventory) v book inventory
- Aging Inventory % - number of products older than x days (define x) v Total inventory
- Markdown Rate – Markdown sales v Total Sales
So, to build a useful Inventory dashboard we would need to pull together demand forecasting data, sales data, and inventory data. We need to take multiple data sets and integrate them, relating them by location, product and time.
A well-designed and well-implemented BI solution can do all this, bringing inventory and demand data together to provide insight and allowing us to answer these questions:
- How much stock do we have, is it adequate?
- Where is our stock?
- Where and what is the demand?
- Is our stock in the right place?
- Are we turning product over fast enough?
- Do we have any aging stock that needs to be shifted?
- Are we replenishing stock effectively?
- What is the value of our stock?
- Are we marking down too frequently due to overstocking?
- Are we seeing restocking due to theft and damage?
- Are we losing sales and profit due to poor inventory efficiency?
Benefit 4: Increased Understanding of Customer Behaviour
As a retailer it is important to understand your customer.
- Who are they?
- How do they shop?
- Where do they shop?
- When do they shop?
- What products do they buy?
- What products do they buy together?
- Do they interact with campaigns?
- Do they take up offers?
- Are they repeat customers or one off?
Understanding who our customers are and how they behave is key to successful retail businesses. If we know our customer’s shopping habits, we can fine tune our marketing, forecast demand and stocking plans accordingly.
We can anticipate their needs based on historic behaviour and market intelligence gathered from customer surveys, mystery shopping and market research campaigns. This in turn can help us to personalise our sales and marketing approach to our customers.
Customer Intelligence can be gleaned from a variety of sources:
- Point of Sale
- Loyalty Schemes
- CRM Systems
- E-commerce Platforms
- Mobile Apps
- Digital Marketing Platforms
- Customer Support and Services Systems
- Instore Technology – footfall counts, dwell time, heatmaps, queue times
- Returns
- Payment Systems
- External Data – market research, location, weather, events, demographics
Common KPIs for measuring customer behaviour include:
- Customer count – active customers
- Customer Growth Quality - New v Returning Customer Rate
- Purchase Frequency – total transactions v total customers
- Average Transaction Value (ATV) – total sales v transactions
- Units per Transaction (UPT) – Units sold v transactions
- Store Conversion Rate – Transactions v Footfall
- Online Conversion Rate – Orders v sessions
- Customer Lifetime Value (CLV /LTV) – average order value x purchase frequency x customer lifespan x margin
- Revenue per Customer – total revenue minus (customer cost of goods sale plus discounts)
- Customer Retention Rate – repeat customers v customers in prior period
- Churn Rate – 1 minus customer retention rate
- Repeat Purchase Rate – customers with 2 or more purchases v total customers
- Loyalty Program Participation Rate – loyalty customers v total customers
- Channel Mix per Customer – single channel v omnichannel
- Net Promoter Score (NPS) - % promotors minus % detractors.
- Return Rate – returned units v units sold
Other customer behaviour we might want to pay attention to is how they speak about us to others either online or in person. Detractors and Promoters are defined by segmenting customers into groups of Promotors (9-10), Passives (7-8) and Detractors (0-6) based on the question “How likely are you to recommend our company/store product to a friend or colleague?”
So with all these metrics in the mix we need to grab data from a wide number of different sources from across departments and then relate them to a customer, product and point in time.
A well-designed and well-implemented BI solution can do this, bringing all this customer behaviour and demographic related data together to provide insight into:
- Where we can sell more to existing customers
- Optimising store layouts with associated products
- Reducing abandoned baskets
- Suggesting other products when online shoppers checkout
- Improving personalised offers
- Growing repeat customers
- Reducing customer churn
- Optimising pricing and promotions
- Improving product offerings
- Ensuring stock is in the right place
- Linking NPS, returns and complaints to customer behaviour and experience
- Measuring campaign success and ROI on marketing and operations
Benefit 5: Better Visibility of Promotion and Pricing Impact on Profitability
Promotions and campaigns are frequently launched on gut instinct, with no data intelligence behind them. But if you can back up decisions on what to promote, who to promote to, how and where, then you can say goodbye to random acts and start to home in on data driven campaigns.
In order to implement cost effective promotions we need to understand the Return On Investment they deliver:
- Can we measure the effectiveness of a promotion?
- How responsive is a customer to price changes?
- What is the impact of discount on profitability?
- What is the impact on demand?
- What is the impact on sales growth?
- What is the impact a new product launch has on cannibalisation – does a new product reduce the sales of older products?
- Are stores delivering promotions correctly?
- Are promotions increasing volume sales but eroding profit margins?
- Are the right customers being targeted for promotions?
- Are promotions personalised adequately for audiences?
- Do demand forecasting and inventory levels account for promotions?
Poorly planned promotions could very easily lead to eroded profits, empty shelves and dissatisfied customers.
A successful campaign is much more than getting a record-breaking number of likes, clicks or products in baskets. Increased demand must be co-ordinated with supply chain so there is enough stock available. Without it customers unable to access the offer will be unhappy, leading to bad social media and negative feedback on ecommerce platforms and ultimately damaged reputation.
By collating data from all related business areas, such as demand forecasting, inventory, sales and marketing it will be easier to have visibility over whether all the requirements are in place before a promotion or campaign is scheduled.
A successful promotion also needs customer intelligence regarding demographics, and data on historic campaign performance to help us avoid patterns that have failed before.
Core data sources that provide valid insight to drive successful promotions and campaigns include:
- Historical sales performance
- Historical Promotion Performance
- Product Pricing and Margin
- Inventory and Stock Position
- Customer Behaviour and Segmentation
- Loyalty Programs
- CRM Systems
- Digital and Omnichannel Behaviour
- Store and Location Performance
- Calendar and Seasonal Performance
- External Data Sources – weather, local events, market trends
- Marketing Channel Performance – impressions, clicks, email opens, cost per acquisition
Here is another clear example where multiple data sets need to be converged and multiple business units need to collaborate to drive accurate data driven insights and business success.
The most effective retail promotion campaigns will bring together expertise on customer demand, inventory risk and profit margin protection.
A well-designed and well-implemented BI solution can bring together all the intelligence data needed to run a highly successful promotion. It can also provide insight into:
- Who to target
- What to promote
- When to promote it
- How much to discount or bundle
- Where to promote
How Do We Do It?
How Do We get a True 360 View for a Retail Business?
For a retail business to get a true 360 view of their customers, products and the performance of their core business functions, collaboration is key.
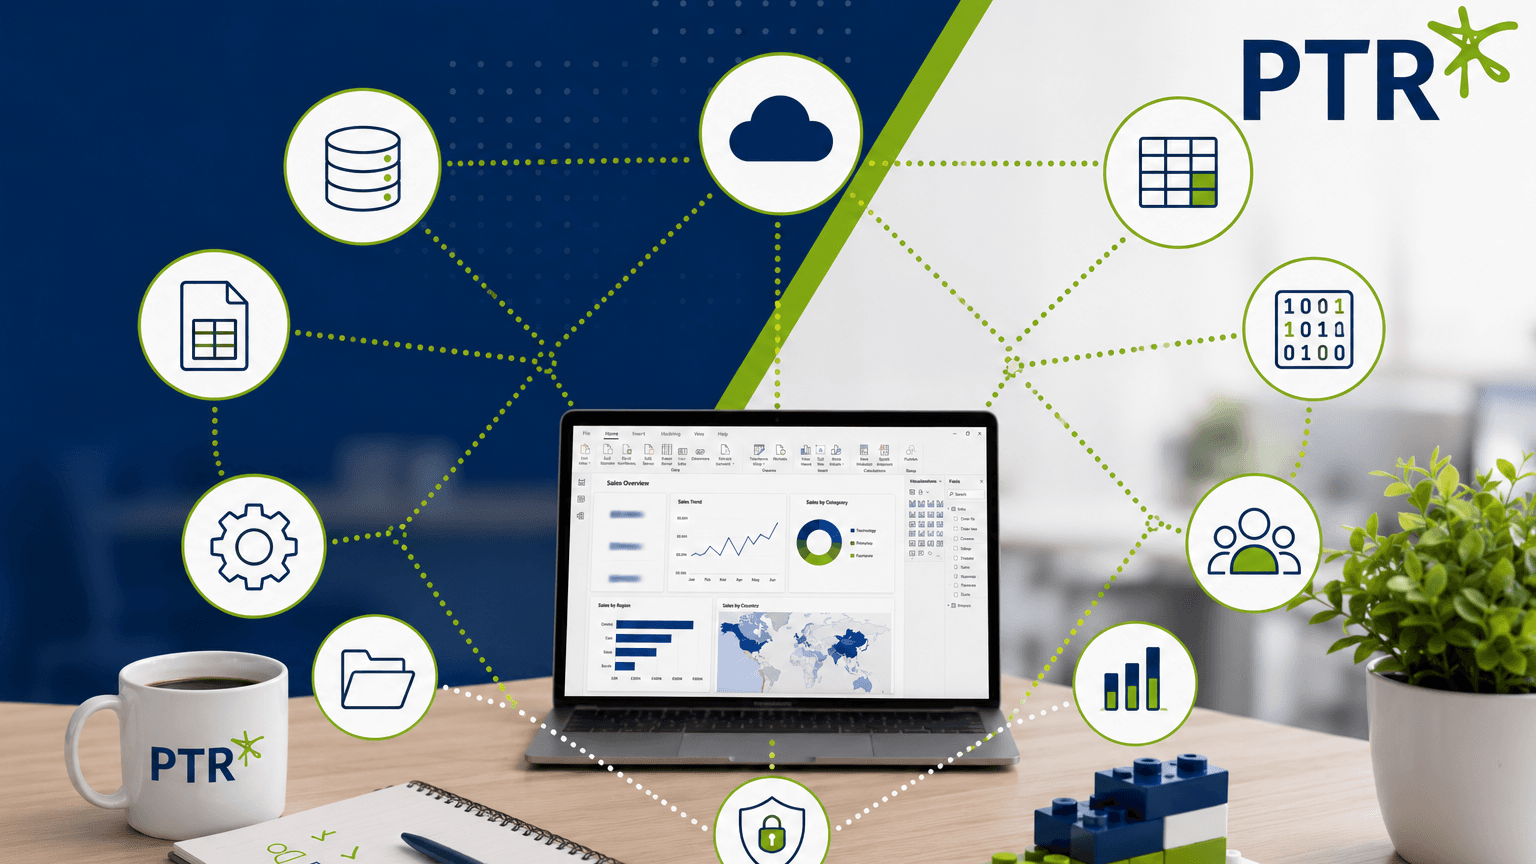
Bringing Data Together
Being able to bring together all the relevant data that relates activities such as sales, returns, campaigns, stores and stock back to each other, is essential when running a successful retail operation. It enables us to calculate a true profit margin including hidden costs as well as the more obvious ones, such as product purchase cost. With rich data we can bring in a number of factors such as supply chain costs, value of returned products and bad debts for a more complete view.
Trying to do it manually is incredibly time consuming and it’s often simply not possible to pull all the data together in time. This means information which could make a difference is often missed and then profitability takes a knock.
Bringing Departments Together
Enterprise BI projects should be a collaboration across the whole business. This enables a common, unified data dictionary to be pulled together ensuring that all business units use the same terminology and the same definitions for core KPIs.
It is also an opportunity to identify data sources common to multiple business functions so that data collection and integration can be done once and the results shared across the business.
Collaboration means that a single source of truth can be created, a single business semantic model that can be used by all departments, enabling data from different systems and sources to be related and presented in a single dashboard and contributing to critical KPIs that can drive better and more timely business decisions.
Integrating Business Data
To achieve our goals we need to do the groundwork that allows us to relate many data sources together e.g. sales data with marketing data and do it consistently. Where different systems have different methods for identifying customers, products or stores you could have problems – for example different IDs, codes, name spellings or multiple records for a single customer.
We need to be able to map customers, products and dates across the whole of the underlying data estate so that we can show one customer with all that relevant information attached to them – from sales to sent campaigns etc
We achieve this by creating:
- a single customer entity which contains all the relevant attributes from every system we are linking the customer to
- a single product entity which contains all the relevant attributes from every system we are linking the product to
- a single date entity that contains all our date extractions required for reporting such as year, quarter, month, week, season. We would also add attributes for multiple calendars such as financial year, financial year month, financial year week
You can see why we need collaboration! We have different data owners, different system administrators, different definitions of business objects and different key attributes that specific business units require for their own reporting. But we also have different business insight and experience to bring meaning to business data and KPIs.
Conforming data from across the business will often be achieved by creating shared repositories such as lake houses, data warehouses, and shared semantic models/data sets that can host the single data dictionary, single source of truth, and be used for all dashboard and reporting needs. Click through to learn more about these topics.
Summary
A successful BI solution will:
- Turn reactive decision making into proactive decision making
- Turn data rich, insight poor businesses into insight, data driven decision making businesses
- Turn fragmented silos of business data into a central single source of truth
- Drive improved customer and staff satisfaction
- Drive increased profitability
It is by no means a simple journey to get to an enterprise-wide BI solution, but if you start with that goal in mind, you can break your journey into smaller chunks, designing and building your solution in readiness for expansion into all business areas.
We suggest you identify one business area to start with - perhaps Sales Performance as that is key to all the areas we have been talking about here, then build it for sharing and expanding by integrating further business areas into one solution rather than separate disjointed BI projects.
If you would like to talk to us about how we have helped our Retail clients do this please get in touch. A successful business intelligence and data analytics solution is within your grasp!
MD
Mandy Doward
Managing Director
PTR’s owner and Managing Director is a Microsoft certified Business Intelligence (BI) Consultant, with over 35 years of experience working with data analytics and BI.

Frequently Asked Questions
Couldn’t find the answer you were looking for? Feel free to reach out to us! Our team of experts is here to help.
Contact Us