Tech Tips
How Do You Create PIVOT Tables In SQL Server Queries?
SQL Server offers the PIVOT function to enable a relational set of records to be summarised and presented in the style of a Pivot Table. Useful for a quick export of summary data.

Working with PIVOT Tables In SQL Server Queries
Many data analysts will be familiar with exploring data using Pivot Tables in Excel workbooks. The following example shows the detail sales data for bike related products, and an Excel Pivot Table created from that data:

The Totaldue values are grouped by Quarter and product.
SQL Server offers the PIVOT function to enable a relational set of records to be summarised and presented in the style of a Pivot Table.
Standard Pivot Table From the PIVOT Function
The following query shows the the individual sales records from the Sales.SalesOrderHeader table in the sample database AdventureWorks.
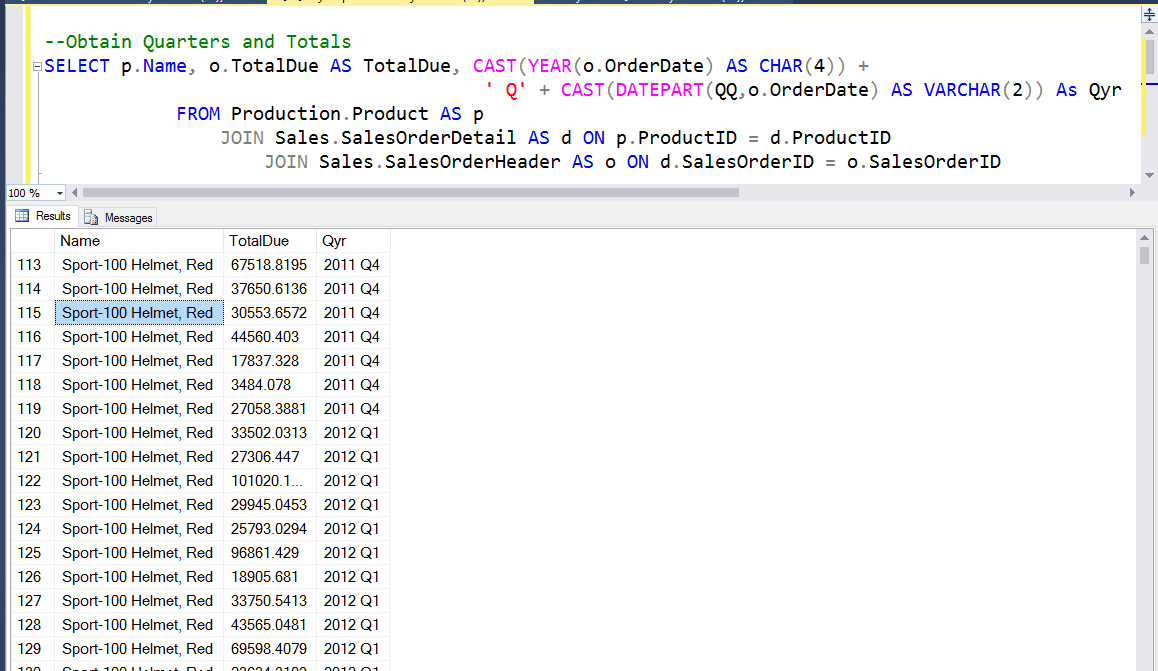
We can see that the data includes sales records from 2011 and 2012. It also includes data from 2013 and 2014.
To generate a Pivot Table from a SQL Server query we must first design a query that generates the raw data. That will be the one shown above. This query will be used as a sub query to provide the source data to the PIVOT function - the row groups to represent (p.Name in the following example), the value to aggregate (o.TotalDue) and the value to use as column headings/groups (Qyr).
	(SELECT p.Name, o.TotalDue AS TotalDue,
			CAST(YEAR(o.OrderDate) AS CHAR(4))
				+ ' Q' + CAST(DATEPART(QQ,o.OrderDate) AS VARCHAR(2)) As Qyr
			FROM Production.Product AS p
				JOIN Sales.SalesOrderDetail AS d ON p.ProductID = d.ProductID
				JOIN Sales.SalesOrderHeader AS o ON d.SalesOrderID = o.SalesOrderID
	) As SourceTable
The second part of the PIVOT query will then define the aggregation (SUM(TotalDue)) to be carried out and the groups to be represented on the columns. Note that the group names must match exactly the group headings specified in the source data (SourceTable).
PIVOT
	(
	SUM(TotalDue)
	FOR Qyr IN ([2013 Q1], [2013 Q2], [2013 Q3], [2013 Q4])
	) AS PivotTable
This particular example only creates Pivot Columns for 2013. To ge the full set of quarters and years you would need to extend the outer SELECT statement to include all the possible values that may appear in the data.

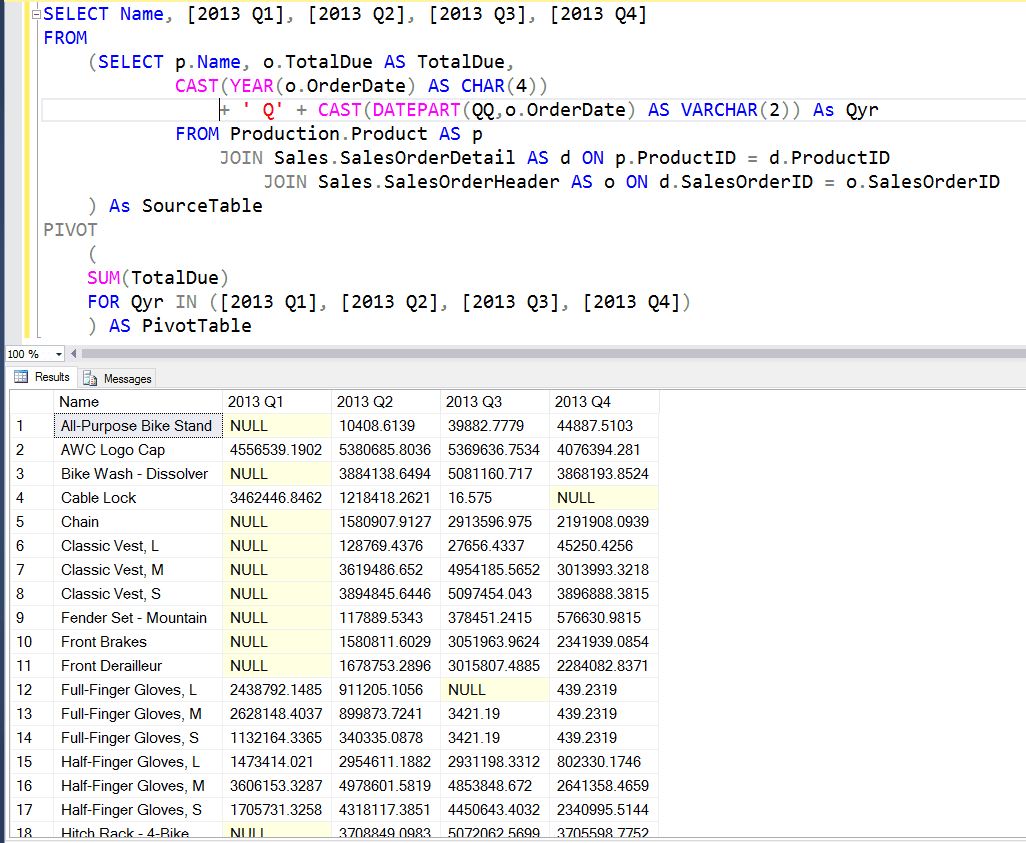
Your Pivot Table is now ready!
Here is the whole query:
SELECT Name, [2013 Q1], [2013 Q2], [2013 Q3], [2013 Q4]
FROM
	(SELECT p.Name, o.TotalDue AS TotalDue,
			CAST(YEAR(o.OrderDate) AS CHAR(4))
				+ ' Q' + CAST(DATEPART(QQ,o.OrderDate) AS VARCHAR(2)) As Qyr
			FROM Production.Product AS p
				JOIN Sales.SalesOrderDetail AS d ON p.ProductID = d.ProductID
					JOIN Sales.SalesOrderHeader AS o ON d.SalesOrderID = o.SalesOrderID
	) As SourceTable
PIVOT
	(
	SUM(TotalDue)
	FOR Qyr IN ([2013 Q1], [2013 Q2], [2013 Q3], [2013 Q4])
	) AS PivotTable
If you would like to learn more about aggregating data in SQL Server SQL queries why not book yourself on to our Advanced SQL Server Database Querying Course? Feel free to contact us at info@ptr.co.uk or call on 0118 9794000.
MD
Mandy Doward
Managing Director
PTR’s owner and Managing Director is a Microsoft certified Business Intelligence (BI) Consultant, with over 35 years of experience working with data analytics and BI.


Frequently Asked Questions
Couldn’t find the answer you were looking for? Feel free to reach out to us! Our team of experts is here to help.
Contact Us