Tech Tips
How to Eliminate Excel Column Merging in Exported SSRS Reports


Exporting simple tabular SSRS reports to Excel usually doesn’t create too many problems. But what about those reports with multiple regions (maybe mixed matrix, table or reports) and textboxes external to regions? These can be a different case altogether and are particularly prone to producing reports with merged cells.
Of course, merged cells are not necessarily a problem if all you want to do is view or print your Excel workbook. However, they can make it impossible for you to use filters or work with the report data in any meaningful way.
So, what is the solution? How do you get rid of the dreaded merged cells?
Unfortunately, doing so can involve a painful process of trial and error to resize and move report components. However, following these two rules will really make your life easier
- Ensure all of your unbound Textboxes are sized to match you tablix width.
- Ensure all unbound textboxes fit within a tablix column.
And we’ve put together an example below to show you how to do this.
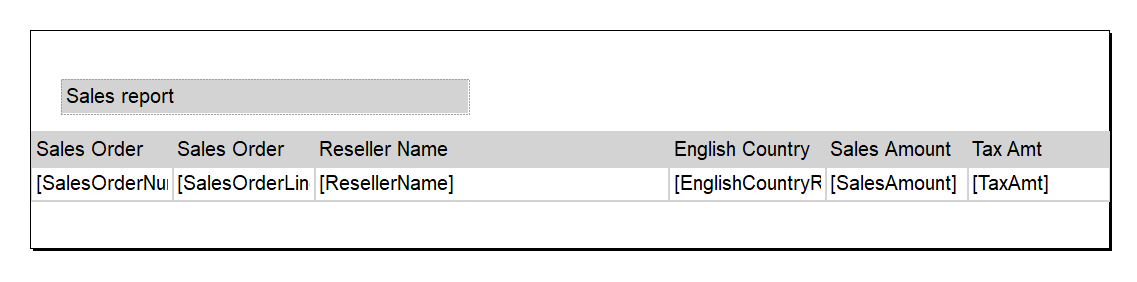
The following simple report layout has a Textbox that isn’t aligned with the start and/or end of the tablix columns. You can see that it starts part way through the Sales Order column.
![ales report Sales Order Sales Order [SalesOrderNul [SalesOrderLin Reseller Name [ResellerNamel English Country Sales Amount Tax Amt [EnglishCountryF (SalesAmount] TaxAmtl
Exporting the report to Excel produces the worksheet below, where columns A and B are separate in Rows 1 to 3, but merged from row 4.
Step 1: Reposition the heading textbox.
Re-running this report eliminates these merged cells – but has created merged cells from row 4 in columns C & D.
Step 2: Align the end of the textbox with a column.
This eliminates the merged columns C & D – but column D is now merged with column E.
Step 3: Resize the textbox to the width of the entire tablix.
Now we are sorted!
IR
Ian Roberts
Technical Director
Ian is an incredibly talented solutions architect. He has over 15 years of experience working with data, as part of a broader IT career spanning over 20 years.


Frequently Asked Questions
Couldn’t find the answer you were looking for? Feel free to reach out to us! Our team of experts is here to help.
Contact Us