Tech Tips
Common Questions About BI
There is a lot of talk about BI in the business world, but the language used to communicate what BI is all about can build barriers to your understanding rather than pick you up and take you on the journey.


If you are confused or overwhelmed when it comes to conversations about BI you are not alone!
There is a lot of talk about BI in the business world, but the language used to communicate what BI is all about can build barriers to your understanding rather than pick you up and take you on the journey.
BI articles can be frustrating and full of assumptions:
- They presume you already have some BI knowledge
- They are full of confusing technical jargon
- They are aimed at enterprise level implementations
- They feature complex solutions
- They focus on the tech rather than the business problem
In this article we are going to take it from the beginning. No assumptions, no overly complicated technical buzzwords (well maybe a few but we will keep the explanations high level!) just the information you need to know.
12 Most Common Questions About BI
Let’s look at the 12 most common BI questions:
- What is BI?
- How will BI benefit me?
- How much will BI cost me?
- How can I get a quick win and ROI from BI?
- What technical skills do I need for BI?
- What should I look for when choosing a BI Platform and Toolset?
- How do I ensure my BI solution is future-proof and scalable?
- What are the pitfalls with BI?
- How do I make BI a success?
- How do I ensure Data Security & Governance with BI?
- How do I encourage User Adoption of a BI Solution?
- Do I need AI and BI?
We will now answer these questions for you in as simple a way as possible.
What is BI?
BI stands for Business Intelligence. But what does that actually mean? Our article titled “What Is Business Intelligence” provides in depth coverage what BI is all about, but we will keep things fairly high level here.
In its simplest form Business Intelligence is what it says – intelligent information derived from your business data.
BI is a single term used to describe any solution that takes data from its raw, stored form and turns it into meaningful reports and dashboards that can help influence business decisions.
But BI means something different to everyone;
- Bigger companies with bigger IT budgets might think of more sophisticated BI solutions.
- Smaller businesses with no IT function and a modest budget should think in terms of an entry level BI solution.
Entry Level BI Solutions
An entry level BI solution will probably focus on one business area and one dataset, and may use an everyday tool such as Excel, or a more purpose designed tool for reporting such as Cliq, Power BI or Tableau.
You will most likely ingest (import) the required source data into the tool of your choice and then create charts, tables and other visualisations from that data.
Entry level BI solutions will serve only a few people, perhaps with a SharePoint location holding the shared spreadsheet or report and permissions used to control who can read or modify it.
Entry level BI solutions will be small in terms of the volume of data consumed by them.
Using Excel for BI
We can have a very simple BI solution that comprises an Excel spreadsheet that has raw data on one sheet, maybe exported from a business system such as a financial accounting system, and a pivot table and chart on another sheet showing yearly and monthly Profit and Loss breakdowns.
Some will argue this is not a BI solution. How can it be a BI solution if it doesn’t cost thousands of pounds and have the latest BI platforms and tools at its heart?
If your reporting and analysis solution provides you with intelligence from your business data then you have a BI solution – even if it is handled entirely in Excel!
Excel is an amazing tool, but to be honest, in the world of BI it is not a terribly scalable or robust solution. As your team grows, the need to share reliable information becomes more important and the drawbacks of Excel become more apparent. It is all too easy to introduce errors into Excel spreadsheets. If you were to accidentally change a key formula that drives your pivot charts and tables, you would end up with incorrect summary information, misrepresenting your performance. What’s more, when your solution is entirely in Excel, sharing with more than a few people becomes problematic.
So, when you get to the point of needing more resilience, data quality control and an easier way to share reports and dashboards, you need to look for a BI solution beyond Excel.
Beyond Excel BI Solutions
Purpose built tools such as Cliq, Power BI and Tableau can take your BI solution to the next level. They offer;
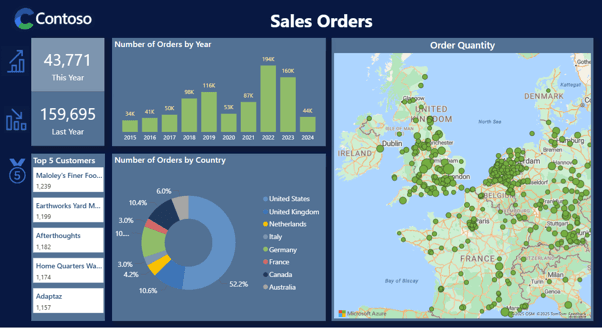
- More sophisticated visualisation options than a pivot chart or pivot table. For example, a geographic map or heatmap that shows sales figures with the wow factor.
- Solutions designed around shared access with capabilities to approve and publish reports to central repositories.
- The ability to separate the reporting layer (the pretty visuals) from your data
- Support for defining your business language (Data Dictionary) and key performance metrics (Business Logic) without exposing complex formulae or running the risk of such formulae from being tampered with.
Choosing the right tool at this stage will also set you on the right path for future growth and scalability as your organisation or your BI needs grow. Have a read of this blog by Steph about Quick wins for moving from spreadsheets to more structured analytics.
Mid-Level BI Solutions
A mid-level BI solution will focus on a layered approach that lends itself to sharing and scalability. They offer.
- Separation of dashboards and reports from the data
- A semantic model which provides a layer for your business language and definitions
- Larger volumes of data
- Incremental loads of data so that only the changes need be brought in rather than the entire data set every time.
A mid-level BI solution might include a Lakehouse or Data Warehouse layer. And what are they you might ask? Put simply they both offer a central location to store all your business data. A Data Warehouse is a bit more structured than a Lakehouse and stores data in tables with known fields and data types. A Lakehouse allows for unstructured data such as emails, images, social media posts and semi-structured data such as JSON and XML data.
Take a look at our Jargon-Busting Guide to data Terms for data terminology explained.
Enterprise Level BI Solutions
An Enterprise level BI solution will be layered, highly scalable, providing support for all your data governance and security requirements and is resilient.
An enterprise BI solution will likely comprise of all or some of the following:
- Lakehouse
- Data Warehouse
- Semantic Model
- ETL/ELT Pipelines
- Report and Dashboard Tools
- DEV/UAT/PROD environment separation and deployment pipelines
For definitions of what these layers are, take a look at our Jargon-Busting Guide to data Terms.
With so many layers, and so many options for platform and infrastructure choices there are many things to consider. The following article covers all considerations behind a successful BI project: What is Business Intelligence?
But briefly an enterprise BI project will involve the following stages:
- Review of Data Estate & Data Strategy Development
- Stakeholder and Business Partner Engagement & Needs Analysis
- Data extraction
- Data storage
- Data Cleansing & Preparation
- Data Shaping & Data Modelling
- Report and Dashboard Design & Development
- Report and Dashboard Publication
How will BI Benefit Me?
A great BI system will give you information at your fingertips and a 360-degree view of your business, all in one place, putting you in a great position to see what is going on and make informed decisions (Data Driven Decisions!).
How many of us have been in a situation where a Monday Morning report takes 5 days to prepare for a 1-hour meeting!
It’s usually a beast of an Excel spreadsheet that one person knows how to use and has evolved over a number of years!
This ratio is upside down. We need to spend more time using data than we do preparing it!
A great BI solution will inevitably save you hours. No more trawling through, looking for data relevant to a report or chart, wrangling it into shape, checking Excel formulae, updating your pivot tables and charts. Time saved can be spent using the information to drive business decisions and actions.
A great BI solution will also put you in a good position to answer those awkward questions in your meeting. Why did sales dip for a particular product, why did they go up in a particular month, what is our projected profit for the end of the financial quarter? The answers are already there in your BI world and with the right dashboard you are just a few clicks away from all the answers you are looking for.
And of course, let’s not forget that a robust BI solution will be central, secure, reliable, trustworthy and accessible by all who need it. Data, business definitions and calculations, reports and dashboards all in one place and using the same single source of truth.
How will BI benefit you? A few benefits here, but I am sure you can think of some more:
- Less time in the detailed data
- Less cost on manpower preparing reports
- Less time defining key performance metrics for the business
- More time analysing business trends and predictions
- More time for decision making
- Faster access to answers about business performance and forecasts
- Trustworthy reports that you can have confidence in
How Much Will BI Cost Me?
Now this is a tough one, how long is a piece of string?
There is a lot of choice when it comes to choosing BI platforms and toolsets, in addition to deciding which business areas the BI solution will cater to. You will have Data Governance, Security and IT infrastructure challenges to plan for. And you may have some applications that present complex challenges for extracting data as well as a raft of key data sources located in spreadsheets, CSV files and other locations managed by individual users.
The first thing to do is to decide whether at this stage an entry level, mid-level or enterprise level solution is best for you.
How will you make that decision? Here are a few questions to get you started:
- How quickly do you need results?
- What is your budget?
- What is the volume of data you need to bring into your BI world?
- Do you have internal resources to build and support a BI solution?
- Do you have any data governance requirements that need to be adhered to?
A data discovery and data strategy review will help you to form an opinion on which type of BI solution may be right for you, and then costings can be assigned to the options available.
How can I get a quick win and ROI from BI?
The best way to get a quick return on investment is to plan before acting!
Start with a data discovery and data strategy review to look at what you have, where you want to go and identify your options. From here there may be a clear winner in terms of solution strategy, but often there are still a few areas to investigate and clarify further.
The key to a quick win is to split your BI journey into manageable chunks, focussing on one business area at a time. You keep your eye on the long-term journey, but you get there with manageable milestones and regular deliverables.
We find that the perfect way to get started and see quick results is to opt for a Proof of Concept (POC) project.
If you start big it will take a lot longer before you have something to see for your money. Think of a business area where a single report could really deliver on solving a problem and that is probably where to start. Not only does this focus the project on specific data subsets, but if you can deliver a wow factor dashboard to one business area. The buzz from the wins will spread around your organisation and help with user adoption and you will be on the road to a new BI driven way of working!
A POC does not meant hat you need to compromise on architecture or solution design. The POC should be planned so that there is a clear journey from proof of concept, to live production and adoption. The only thing you need to compromise on is the target dashboards and the volume of data.
Of course, sometimes it may be sensible to run a throw away POC where perhaps data sources are complete unknowns, and some initial experimenting might be needed to do a feasibility study before launching into full blown project development.
What technical skills do I need for BI?
This will depend on the type of BI platform and toolset you choose. But as a minimum you are looking at access to skills in database technology, SQL and data analytics methodology.
Do you need to have these resources internally? Not necessarily. If you wish to be completely self-sufficient with the development and implementation of your BI project then yes, you will need a lot of internal BI skills resource.
Alternatively, you could take a mentoring approach to your BI project and engage a BI consultancy provider to guide, mentor and train your team while building and implementing your BI solution.
Or you could opt for a BI consultancy provider to fully develop and implement your BI project and go on to support it for you, or go on to provide training, mentoring and support to your internal team to give you total ownership and management going forward.
We work with clients in all these ways – there is always a solution that fits your situation. And there is always a BI learning path to suit your needs.
What should I look for when choosing a BI Platform and Toolset?
Fundamentally you want to choose a platform and toolset that fits your needs and skills now, but is also scalable, affordable and within your team’s skill set, so that as your business and data needs grow your BI solution can grow with you.
Once again, we see the need for an initial data discovery and data strategy review exercise to put you in the best place to make decisions about the right BI platform and toolset.
How do I ensure my BI solution is future proof and scalable?
Choose the right BI platform and toolset from the start. All successful BI projects will start with a data discovery and data strategy phase to assess current and future needs along with investigations into where data is located and how it can be accessed and retrieved.
What Are the Pitfalls With BI?
The bulk of BI project fail due to poor user adoption. If your business users to do not engage with your BI solution it will fail. Involve business stakeholders and business partners from the start to ensure that what is delivered is what they need and solves their problems, rather than delivering something they see no value in and find difficult to understand and use.
The second biggest pitfall with BI is probably lack of planning for the future. If you know that within 12 to 18 months you are going to have terabytes of data, hundreds of dashboards, requiring hundreds or thousands of business performance metrics and a desire to integrate multiple business areas to facilitate a 360-degree view of your business, don’t start with an entry-level BI solution, It will rapidly become unfit for purpose.
Complex BI solutions with no internal staff to support it is another common BI pitfall. If you have taken delivery of a new BI solution, but nobody within your organisation knows how to manage, support and grow it, then what will happen if there is a service or system failure, or the source data changes shape? How will you get your BI solution back up and running, what will you do if extra data is required for some new dashboards?
How do I make BI a success?
Four important things here:
- Listen!
- Collaborate!
- Plan!
- Engage!
- Beautiful Dashboards!
Listen to all the people your BI solution is supposed to help. Take on board what their pain points currently are and what will really help them to be more efficient and better equipped to do their jobs in the future.
A BI project should not be designed solely by a Tech team. They may understand the technology very well, but do they really understand every aspect of your business operations, what data means, how it should be interpreted, and how it needs to be presented to those who need it? Your business stakeholders and partners are the ones who understand the data and the challenges they have getting useful information. They are the ones who will benefit from making better decisions. So, collaborate, work together with Tech and Business to assess the real needs of your BI project.
Planning is an absolute must here. Discuss requirements, review what you have and what you would like to have. Involve experts to help you with your review and data discovery, and ask for a BI data strategy document that outlines your options with clear cost, effort and timeline indications.
You must engage the business! If you have listened, collaborated and planned this should be a natural progression for your BI project. Take your business users on the BI data journey with you to ensure successful user adoption.
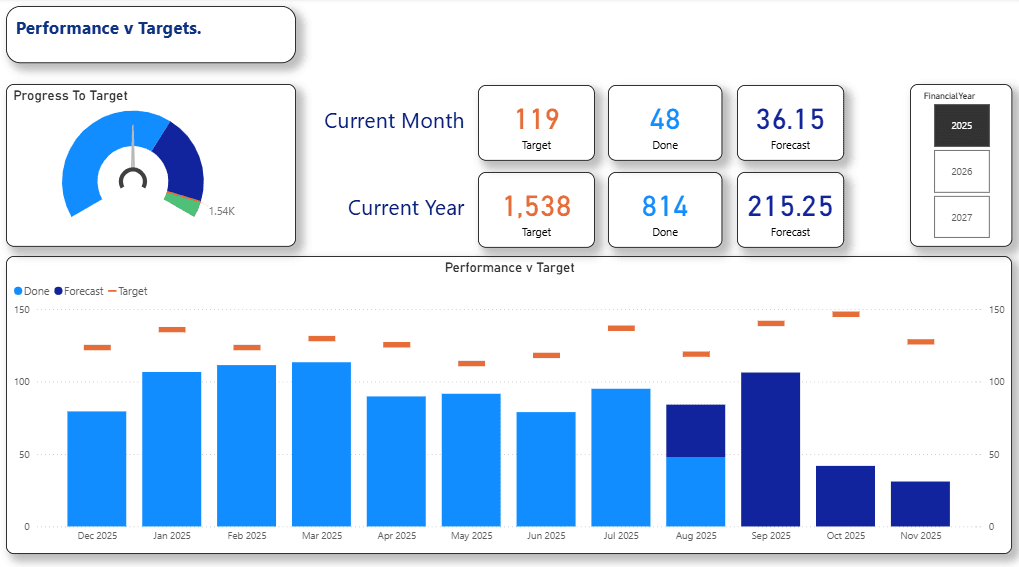
Make sure any dashboards you publish and deliver to users are well designed, consistent in layout and style, and tell a clear story. A dashboard should clearly convey the headline story and invite and encourage users to interact with it through slicers, filters and engaging visuals. Don’t be tempted to over-clutter a dashboard or you will lose its impact and ease of use. If a user can’t tell what a dashboard is about and how to use it within 20 seconds, consider it a fail! Designing beautiful dashboards is an art. Have a read of our Story Telling With Beautiful Dashboards article.
How do I encourage User Adoption of a BI Solution?
The best way to encourage user adoption is to involve users during your BI project development.
Run stakeholder workshops to gather information about pain points, needs, wishes and desires.
Run training workshops to introduce users to new tools and show them how to get the best out of new dashboards and reports.
Encourage feedback with regular user groups or Q&A sessions so that development is a two-way process with user testing and feedback influencing functionality, tweaks and changes to key performance metrics, dashboard design.
We are back with listen and collaborate! If people feel part of the process, they will become engaged and invested and will in turn become advocates that spread the word around your business to increase user adoption.
How do I ensure Data Security & Governance With BI?
Involve your Data Governance and Security officers from the start so that you know up front what challenges you may face in making sensitive or confidential data available to the BI world.
Will you need to obfuscate/anonymise data?
Will you need to separate raw data from analysts to protect it from unauthorised access or exposure?
Once you understand the constraints and challenges you can plan for a solution architecture that can deliver the governance and security required.
Do I need AI and BI?
Maybe!
AI (Artificial Intelligence) can bring big benefits to your BI solution in both the data preparation stages and, in the trend, forecasting and predictive analysis areas.
In the data preparation stages of a BI project Ai can really help in data profiling and cleansing data ready for use in the BI world. Our article How can I use the power of AI for data Profiling and Cleansing looks at this.
Machine learning, natural language processing and predictive analytics are all AI capabilities that can help with analysing vast amounts of data at speed for predictive analysis and forecasting to help keep your business ahead of your competitors.
Our article The Role of AI in Business Intelligence explores this area in more detail.
Getting Started On Your BI Journey
We hope this has answered your most pressing questions about the benefits of Business Intelligence. Each organisation has different needs so we are very happy to chat to you one to one about what would suit you best, from dipping a toe into the water to a complete business transformation. Do feel free to contact us at info@ptr.co.uk or call us on 0118 979 4000.
MD
Mandy Doward
Managing Director
PTR’s owner and Managing Director is a Microsoft certified Business Intelligence (BI) Consultant, with over 35 years of experience working with data analytics and BI.
Related Articles
Frequently Asked Questions
Couldn’t find the answer you were looking for? Feel free to reach out to us! Our team of experts is here to help.
Contact Us