Tech Tips
Microsoft Power BI: How to - Pivot and Unpivot Columns
Pivot and Unpivot Columns in Power BI PTR is proud to provide Microsoft Power BI consultancy services to help you and your business get the most from your data but when only a quick answer will do, here is the latest in our series of bite-sized “How to” g

Pivot and Unpivot Columns in Power BI
PTR is proud to provide Microsoft Power BI consultancy services to help you and your business get the most from your data but when only a quick answer will do, here is the latest in our series of bite-sized “How to” guides for Power BI, looking at the pivot functionality within Power BI.
Using Power Query
In Microsoft Power BI, "Pivot" and "Unpivot" refers to 2 ways you can reshape your data using the Power Query Editor. Turn rows into columns and columns into rows!
Pivot
When you pivot your data, you turn the table on its side.
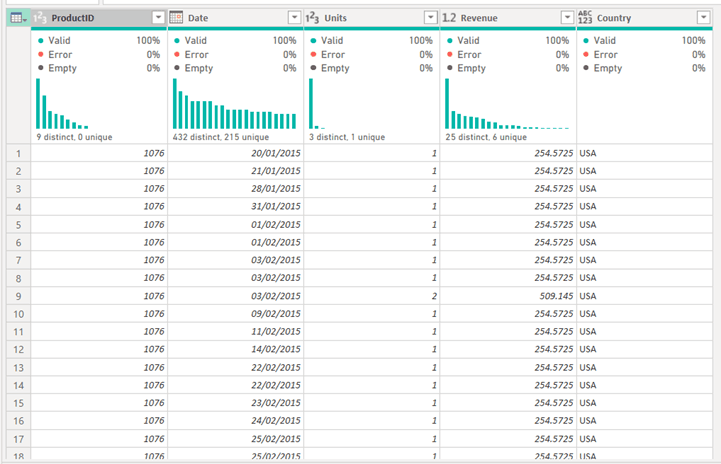
In this example we have Sales data. The table contains Revenue and Units by Product ID, Date and Country.
We want to create a pivoted table that shows the total revenue for each product, grouped by Country.
How to…1. Open Power Query. To do this, click on Transform Data in the Home ribbon at the top of the Power BI Desktop file.
2. Select Columns: Choose the columns you want to pivot.
3. Transform: Go to the "Transform" tab and click "Pivot Column." Select the values to be pivoted. In this case we will click the Country column.
4. In the Pivot pop-up box, choose the Value column as Revenue.
5. The resulting table creates 7 new columns in the data, one for each country represented in the data, and sums Revenue by each of these countries within the table.
Unpivot
When your data is spread across multiple columns, for example different months and you want to bring it together, then unpivot is a valuable function to use.
To demonstrate this, we have a simple query with Years and Months of Revenue data, as seen below. We want to Unpivot this to have a Year and Month column rather than per year.
How to…1. Open Power Query. To do this, click on Transform Data in the Home ribbon at the top of the Power BI Desktop file.
2. Select Columns: Select the columns you want to unpivot. In this case we will
3. Transform: In the "Transform" tab click "Unpivot Columns." This will transform your columns into two: one for attribute names and one for values. In the example, attribute will be Year and Values will be month.
The result is as shown below. You can change your column headings to something more relevant than ‘Attribute’ and ‘Value’ by double clicking on them, or alternatively right click on the column heading and click ‘Rename’.
Definition
Pivot: Reshape your data by transforming columns into rows.
Unpivot: Gather data in one place by converting columns into rows.
Uses
Power BI's Pivot functionality allows you to easily turn your rows of data into columns, with the ability to summarise and aggregate your data. Power BI's Unpivot functionality does the reverse by turning your columns of data into rows, which not only gives you a better performance from your Power BI but can also be more suitable for analysis in your reports and subsequent calculations.
Get the most from your Power BI - arrange your data and prepare for powerful visualizations. PTR experts are always available for Power BI consultancy and Power BI training if you have any further questions.
Our comprehensive Power BI Training courses can be found here or we can create something that directly fits your needs.
To enquire further, visit us here to BOOK NOW
We offer a blended consultancy and training approach to helping you with your Power BI Data Journey: Microsoft Azure BI Solutions Training, Data Strategy Consulting, Data Analytics Consulting, Power BI consulting and Microsoft Fabric Consulting and that’s just for starters. Please contact us for your bespoke training course.
Please contact info@ptr.co.uk to find out how we can help you.
HM
Hayley Mclaughlin
Business Intelligence Consultant
With over seven years in data and analytics, Hayley specialises in end-to-end BI implementations, from design and development to delivery and support.


Frequently Asked Questions
Couldn’t find the answer you were looking for? Feel free to reach out to us! Our team of experts is here to help.
Contact Us