Blog Post
SQL Server - Monitoring Logical and Physical Reads & Buffer Cache Usage

Monitoring Logical and Physical Reads & Buffer Cache Usage
Many SQL Server performance problems will come down to poor physical disk performance or inadequate memory resource. This article takes a look at the Buffer Cache and some of the tools that we have for troubleshooting poorly performing SQL Server instances and queries.
Throughout this article we will meet a number of Dynamic Management Views, Functions and System Views:
SQL Server Buffer Cache Usage
SQL Server implements a Buffer Cache to improve performance of Read and Write requests from SQL statements. All records that have been selected, updated, deleted or inserted will have passed through the buffer cache as memory is much faster to read from and write to than physical disks. Records are stored in 8K pages in data files, and it is these 8K pages that are cached in the buffer cache. The buffer cache is instance wide and so is shared by all sessions and users.
If there is insufficient memory available for the SQL Server Buffer Cache, client sessions will have to wait while buffer pages are freed and new pages are read from disk. Ideally we would like to see that most of our reads and writes are being satisfied from cache and not incurring physical IO waits.
We can check the Buffer Cache Hit Ratio with the following query:
The result from this query is two records as shown below:
To calculate the actual Buffer Cache Hit Ratio you divide the Buffer cache hit ratio by the Buffer cache hit ratio base. The following query shows this calculation:
This example shows a very healthy buffer cache hit ratio. It should always be higher than 90% and as close to 100% as possible.
Another way to monitor the buffer cache hit ratio is using Performance Monitor. Add the Buffer Cache Hit Ratio counter from the SQL Server: Buffer Manager Performance Object.
The above screen shot shows that the Buffer cache hit ratio is currently 100%, but during the collection period of 100 seconds shown in the chart it dropped to a low value of 99.729%, with the average over the collection period being 99.979%.
The buffer cache hit ratio is likely to be continually changing on a busy system and the cntr_value values for the sys.dm_os_performance_counters view will also be continually changing depending upon how many pages are being accessed by the instance at a given time.
The following query shows the number of pages currently in the Buffer Cache:
Here is an example:
We can also monitor the number of pages by adding the SQL Server: Buffer Manager Database Pages counter:
SQL Server Buffer Cache Performance
As already mentioned, pages are brought in to the Buffer cache to satisfy not just SELECT statements, but INSERTs, UPDATEs and DELETEs. New data and changed data is written to cache and later written out to disk (that’s another story!).
If we are monitoring a SQL Server instance and find that Buffer Cache Hit Ratio is low it may indicate that we don’t have enough RAM in our server to allow all data that is being accessed to remain resident in the Buffer cache. However, just looking at the Buffer cache Hit Ratio does not show the whole picture of what might be going on behind the scenes. We should not assume that we are short of RAM without a full investigation. For example, queries from hell – such as queries that retrieve millions of records unnecessarily – may well result in records that are used regularly being purged from the Buffer Cache to make way for the huge record set that has been requested. This would be a situation that could be resolved with a bit of user education rather than rushing out to buy more memory!
If you are content that there are no such queries and that you are seeing contention for Buffer Cache then you might consider increasing the amount of RAM available to your SQL Server instance.
In some cases it may not be possible to increase the available RAM and so we must tackle the problem from another angle – reducing the demand for Buffer Cache. This means tuning queries, creating better indexes, dropping redundant indexes. Any changes that would result in fewer pages being requested will reduce the demand on Buffer Cache pages.
Is a Buffer Cache Shortage Causing a Query to Run Slowly?
There are many factors that can cause a query to run slowly, but we will focus on determining if IO operations and shortage of buffer cache are a potential problem.
Using a mix of Performance Monitor, SQL Server Profiler or Extended Events, and Dynamic Management Views we can deduce quite a lot about the number of Page Reads and Page Writes that are being incurred by an SQL statement. In this article we will focus on using Dynamic Management Views.
Monitoring Logical and Physical Reads For SQL Server Queries
The following query displays a Read operation summary for queries that include the string “MyOrder”. This filter is just to limit the output for ease of understanding. You could replace this with an extract of a query you are interested in analysing, or you could simply sort all known queries by any counter of intrest.
The following screen shot shows the result from this query ona SQL Server 2014 instance:
We can see from this example that the select statement shown in row 1 (SELECT * FROM MyOrders) has been executed once (the execution_count column) and that the highest number of logical reads incurred by a single execution of this statement is 786. The highest number of Physical reads incurred is 780. This would be the case where the records were not already in the Buffer Cache and needed to be retrieved from disk.
If you would like to follow these examples the table MyOrders was created from the following query run against the AdventureWorks2014 database:
We now run the SELECT * FROM MyOrders a second time and then repeat the query to display read information:
We can see that the statement has been executed twice and that the last_logical_reads value is 786, but the last_physical_reads value is 0. This confirms that the pages for this query are being retrieved from Buffer cache and the query is not waiting for physical disk operations.
Now we run the query a third time and repeat our dynamic management view query:
The last_logical_reads and last_physical_reads values remain unchanged. Note that the total_logical_reads now shows 2358 (3 x 786), but the total_physical_reads remains at 780. This enables us to calculate how often the pages are retrieved from cache and how often from disk when a query is run repeatedly over time.
Monitoring Logical Writes For SQL Server Queries
When records are updated, deleted or inserted Logical Writes will be incurred. All changes to records are made in the Buffer Cache. These pages will be marked as Dirty Pages. Transaction Log Buffers and the Transaction Log file enable this write caching while ensuring reliability and recoverability.
The sys.dm_exec_query_stats dynamic management view only contains counters to measure Logical Writes. This is because ultimately all Logical Writes will result in Physical Writes, but not at the time of the transaction. The Physical Writes are carried out when a CHECKPOINT takes place.
The following query will show us the number of Logical Writes incurred by an SQL statement:
Here are the results from this query after an UPDATE statement is issued for the first time following an instance restart:
780 pages were written to as a result of the UPDATE statement.
Now we run the UPDATE a second time and re-run the dynamic management view query again:
We can see the UPDATE statement has been executed twice, and we can see that there were once again 780 logical writes incurred. Notice that the last_logical_writes counter is 0. This counter will show 0 if the pages modified are already dirty. It is clear from the results that no CHECKPOINT has been issued in between UPDATEs and so the pages affected were already dirty. The last_logical_writes counter only counts pages that were clean before the update.
The following query was run after a CHECKPOINT nad then a third UPDATE statement:
We can see that the UPDATE resulted in 780 clean pages being made Dirty. We can also see that the cumulative total of dirty pages generated by this query is 1560.
Displaying Buffer Cache Content Summary
It may also be useful to be able to identify which database and/or tables and indexes are occupying the most pages in the Buffer Cache.
Database Buffe Cache Pages Summary
The following query will show a list of all existing databases along with a count of how many pages they occupy in the Buffer Cache:
Table & View Buffer Cache Pages Summary
The following query will display a list of all objects along with a count of the number of Buffer Cache pages they currently have:
Here is a partial results set:
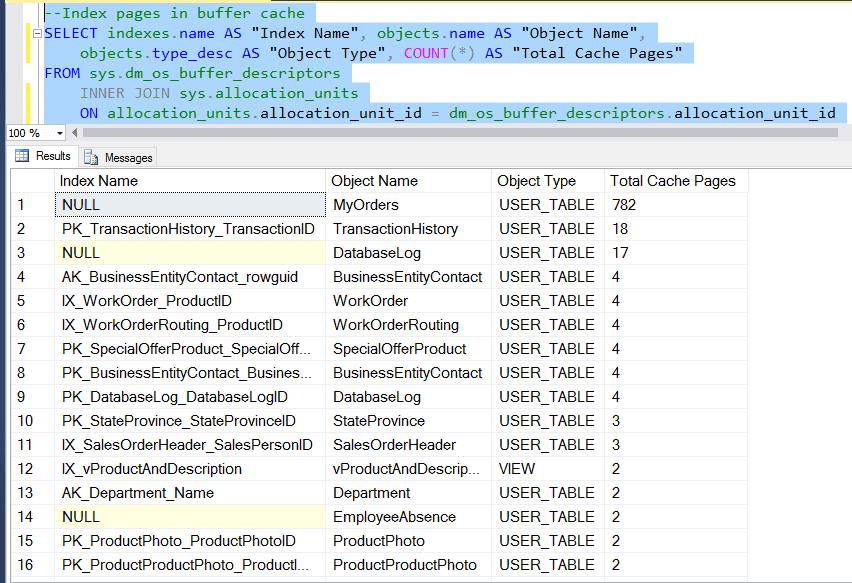
Index Buffer Cache Pages Summary
The following query will display a list of all indexes along with a count of the number of Buffer Cache pages they currently have:
Here is a partial result set:
I hope that this article has given you a bit of an insight into investigating Buffer Cache and Logical/Physical IO issues for your queries.
If you would like to learn more about SQL Server Architecture and Performance take a loom at our SQL Server Performance & Tuning course.
MD
Mandy Doward
Managing Director
PTR’s owner and Managing Director is a Microsoft certified Business Intelligence (BI) Consultant, with over 35 years of experience working with data analytics and BI.


Frequently Asked Questions
Couldn’t find the answer you were looking for? Feel free to reach out to us! Our team of experts is here to help.
Contact Us