SSRS – Export to Excel With Each Region on a Separate Named Worksheet
Here we will learn how to design an SSRS report that will export each region to a separate worksheet in Excel.
The following report contains four Tablix regions. Each one is a table with a single row group representing a calendar year. The Dataset contains a SELECT statements that aggregates sales amount by year and country:
SELECT DimDate.CalendarYear, DimGeography.EnglishCountryRegionName, FactResellerSales.SalesAmount
FROM DimReseller
        INNER JOIN DimGeography
        ON DimReseller.GeographyKey = DimGeography.GeographyKey
        INNER JOIN FactResellerSales
        ON DimReseller.ResellerKey = FactResellerSales.ResellerKey
        INNER JOIN DimDate
        ON FactResellerSales.OrderDateKey = DimDate.DateKey
GROUP BY DimDate.CalendarYear, DimGeography.EnglishCountryRegionName, FactResellerSales.SalesAmount
This example is based on the AdventureWorksDW2014 sample database (dates are in the years 2010 through to 2013 in this version of AdventureWorksDW).
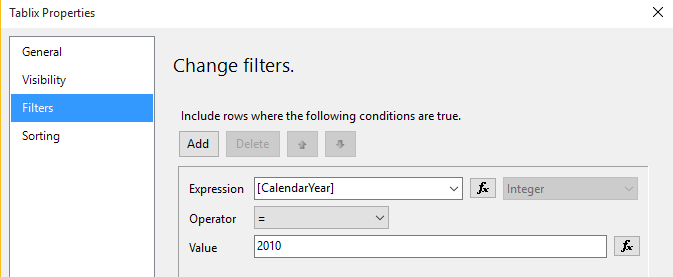
Each Tablix has a filter on it - one is filtered by calendar year for 2010 and the others for 2011, 2012 and 2013 respectively.
Each Tablix has the PageName property set to the desired name of an Excel Worksheet for when the report is exported to Excel:

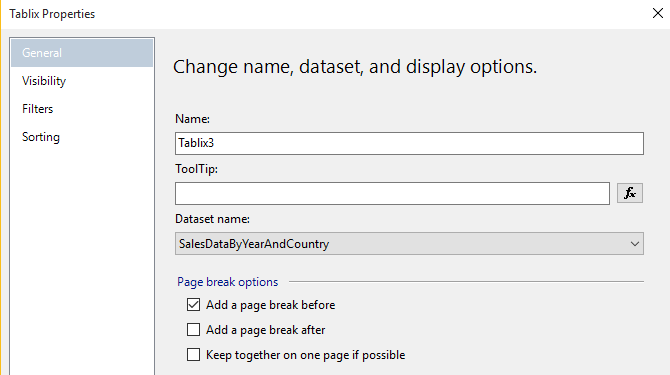
The second, third and fourth Tablix regions have a Page Break defined before the region. This can be seen in the Properties Window (above) and the Tablix Properties dialog:
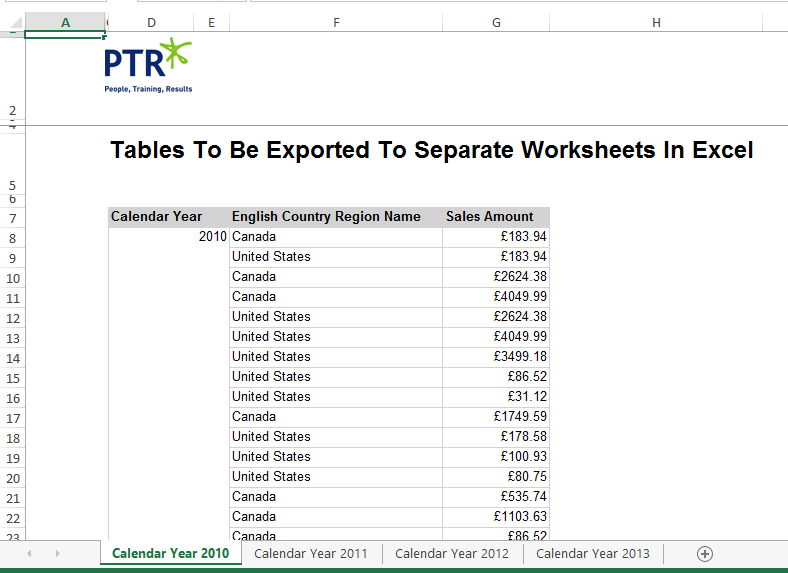
With the combination of page breaks and the PageName property set each Tablix will now be placed on a separate |Worksheet when exported to Excel, as shown below:
You can learn more about designing reports for SSRS by attending our (SSRS) SQL Server Reporting Services Course.